Volvo 1997 Annual Report Download - page 57
Download and view the complete annual report
Please find page 57 of the 1997 Volvo annual report below. You can navigate through the pages in the report by either clicking on the pages listed below, or by using the keyword search tool below to find specific information within the annual report.-
 1
1 -
2
-
3
-
4
-
5
-
6
-
7
-
8
-
9
-
10
-
11
-
12
-
13
-
14
-
15
-
16
-
17
-
18
-
19
-
20
-
21
-
22
-
23
-
24
-
25
-
26
-
27
-
28
-
29
-
30
-
31
-
32
-
33
-
34
-
35
-
36
-
37
-
38
-
39
-
40
-
41
-
42
-
43
-
44
-
45
-
46
-
 47
47 -
 48
48 -
 49
49 -
 50
50 -
 51
51 -
 52
52 -
 53
53 -
 54
54 -
 55
55 -
 56
56 -
 57
57 -
 58
58 -
 59
59 -
 60
60 -
 61
61 -
 62
62 -
 63
63 -
 64
64 -
 65
65 -
 66
66 -
 67
67 -
68
-
69
-
70
-
71
-
72
-
73
-
74
-
75
-
76
-
77
-
78
-
79
-
80
-
81
-
82
-
83
-
84
-
85
-
86
-
87
-
88
-
89
-
90
-
91
-
92
-
93
 |
 |

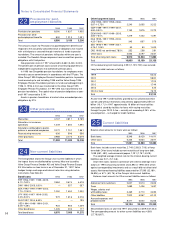
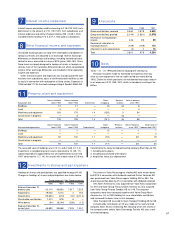
55
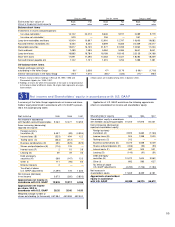
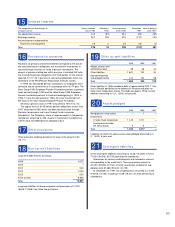
Dec 31, 1995 Dec 31, 1996 Dec 31, 1997
Estimated fair value of Book Fair Book Fair Book Fair
Volvo’s financial instruments value value value value value value
Balance sheet items
Investments in shares and participations:
fair value calculable 114,122 24,272 8,646 9,917 2,089 5,779
fair value not calculable 2529 — 206 — 361 —
Long-term receivables and loans 10,904 10,897 12,991 12,797 19,690 19,682
Accrued interest, receivables, etc 6,452 6,340 8,599 8,365 20,459 20,477
Marketable securities 15,817 16,139 21,577 22,059 10,962 11,203
Cash and bank 7,489 7,489 5,084 5,084 9,641 9,641
Long-term loans 16,885 16,784 18,189 18,145 23,135 24,168
Short-term loans 11,691 11,396 14,263 14,427 18,282 18,309
Accrued interest, payable, etc 1,102 1,101 1,315 1,294 1,288 1,281
Off-balance sheet items
Foreign exchange contracts
outstanding in the Volvo Group 96 32,608 47 33,179 (199)3(1,716)
Interest-rate contracts in the Volvo Group (157) 31,615 (85) 3(423) (77)3(957)
1 Pertains mainly to Volvo’s holdings in Renault SA 1995–1996 and
Pharmacia & Upjohn, Inc. 1995–1997.
2 Holdings of shares for which the calculation of fair value is not practical due
to the large number of different stocks. No single stock represents any signi-
ficant amount.
3 Book values are included among items in balance sheet.
■■
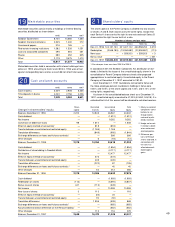
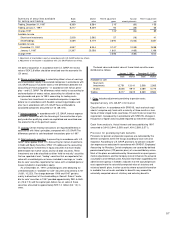
31 Net income and Shareholders’ equity in accordance with U.S. GAAP
Net incom e 1995 1996 1997
Net income in accordance
with Swedish accounting principles 9,262 12,477 10,359
Items increasing (decreasing)
reported net income:
Foreign currency
translation (A) 5,457 (89) (4,994)
Income taxes (B) (523) 494 122
Tooling costs (C) (633) (312) —
Business combinations (D) 355 (529) (529)
Shares and participations (E) (116) 176 —
Interest costs (F) 2 15 28
Leasing (G) 49 49 46
Debt and equity
securities (H) 368 (147) 123
Other (I) 111 (95) 65
Minority interests 2 — —
Tax effect of above
U.S. GAAP adjustments (1,399) 178 1,336
Net increase (decrease)
in net income 3,673 (260) (3,803)
Approximate net income in
accordance with U.S. GAAP 12,935 12,217 6,556
Approximate net income
per share, SEK in
accordance with U.S. GAAP 28.20 26.40 14.50
Weighted average number of
shares outstanding (in thousands) 457,984 463,558 452,540
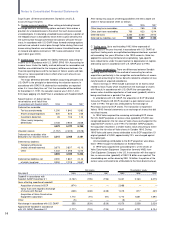
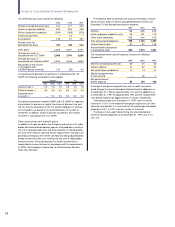
Shareholders’ equity 1995 1996 1997
Shareholders’ equity in accordance
with Swedish accounting principles 51,200 57,876 60,431
Items increasing (decreasing)
reported shareholders’ equity:
Foreign currency
translation (A) 3,920 3,660 (1,163)
Income taxes (B) 904 1,398 1,520
Tooling costs (C) 312 — —
Business combinations (D) 6,070 2,558 2,029
Shares and participations (E) (266) (90) (90)
Interest costs (F) 487 503 531
Leasing (G) (140) (91) (51)
Debt and equity
securities (H) 10,472 1,604 3.962
Other (I) 682 583 627
Tax effect of above
U.S. GAAP adjustments (4,782) (1,726) (1,184)
Net increase in
shareholders’ equity 17,659 8,399 6,181
Approximate shareholders’
equity in accordance
with U.S. GAAP 68,859 66,275 66,612
A summary of the Volvo Group’s approximate net income and share-
holders' equity determined in accordance with U.S. GAAP, is presen-
ted in the accompanying tables
Application of U.S. GAAP would have the following approximate
effect on consolidated net income and shareholders’ equity: