Volvo 1997 Annual Report Download - page 20
Download and view the complete annual report
Please find page 20 of the 1997 Volvo annual report below. You can navigate through the pages in the report by either clicking on the pages listed below, or by using the keyword search tool below to find specific information within the annual report.
18
Board of Directors’ report
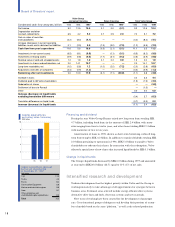
Financing and dividend
During the year Volvo Group Finance raised new long-term loans totaling SEK
4.7 billion, including bond loans in the amount of SEK 2.4 billion with matu-
rities ranging from four to twelve years, and other loans totaling SEK 2.3 billion
with maturities of two to ten years.
Amortization of loans in 1998, shown as short-term borrowing, reduced long-
term borrowing by SEK 4.2 billion. In addition to regular dividends totaling SEK
2.0 billion pertaining to operations in 1996, SEK 5.8 billion was paid to Volvo
shareholders to redeem their shares. In connection with the redemption, Volvo
effected a special issue of new shares that increased liquid funds by SEK 0.1 billion.
Change in liquid funds
The Group’s liquid funds decreased by SEK 6.0 billion during 1997 and amounted
at year-end to SEK 20.6 billion (26.7) equal to 11% (17) of net sales.
Intensified research and development
Technical development has the highest priority within Volvo and the Group is
working intensively to take advantage of all opportunities for synergies between
business areas. Technical areas selected include energy-efficient drive systems,
alternative drive lines and fuels, electronic systems and new materials.
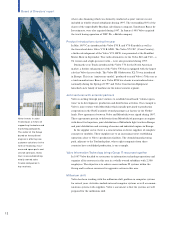
New ways of working have been created for the development of passenger
cars. Cross-functional groups of designers each develop their portions of a num-
ber of models based on the same “platform,” as well as the related production
Volvo Group
excl sales financing Sales financing Total Volvo Group
Condensed cash flow analyses, billion 1995 1996 1997 1995 1996 1997 1995 1996 1997
Net income 9.2 12.5 10.5 0.1 0.0 (0.1) 9.3 12.5 10.4
Depreciation and other
noncash-related items 6.5 4.2 5.2 0.7 0.9 2.0 7.2 5.1 7.2
Gain on sales of securities
and subsidiaries (4.2) (8.2) (4.1) — — — (4.2) (8.2) (4.1)
Increase (decrease) in current operating
liabilities, assets and in deferred tax liabilities 0.1 (2.9) 5.0 (1.3) (3.0) (7.0) (1.2) (5.9) (2.0)
Cash flow from year’s operations 11.6 5.6 16.6 (0.5) (2.1) (5.1) 11.1 3.5 11.5
Investments in non-current assets (6.5) (8.1) (9.8) — (0.1) (0.1) (6.5) (8.2) (9.9)
Investments in leasing assets (0.9) (0.8) (0.5) (1.7) (3.1) (9.3) (2.6) (3.9) (9.8)
Residual value of sold and scrapped assets 1.2 1.8 1.0 0.1 0.2 0.9 1.3 2.0 1.9
Investments in shares and participations, net 2.0 14.1 10.7 ———2.0 14.1 10.7
Long-term receivables, net (1.0) (0.8) 1.2 (1.0) (2.0) (7.2) (2.0) (2.8) (6.0)
Acquisitions and sales of companies (4.4) (0.9) (1.3) — — — (4.4) (0.9) (1.3)
Remaining after net investments 2.0 10.9 17.9 (3.1) (7.1) (20.8) (1.1) 3.8 (2.9)
Increase in loans 2.2 3.3 4.4
Dividends paid to AB Volvo shareholders (1.5) (1.9) (2.0)
Redemption of shares ——(5.8)
Settlement of loans to Renault — (1.5) —
Other 0.0 0.0 0.0
Increase (decrease) in liquid funds
excluding translation differences (0.4) 3.7 (6.3)
Translation differences on liquid funds (0.7) (0.3) 0.3
Increase (decrease) in liquid funds (1.1) 3.4 (6.0)
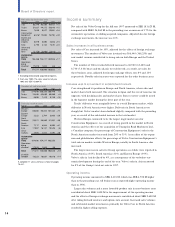
Capital expenditures,
excluding sales financing
SEK billion
10
8
6
4
2
9695
97
Capital expenditures approved
but not yet im plemented
at Decem ber 31, 1997
SEK billion
Cars 13,9
Trucks 4,9
Buses 0,2
Construction Equipment 0,0
Marine and industrial engines 0,0
Aero 0,7
Other companies and
undistributed capital expenditures 0,3
Total 20,0


