Volvo 1997 Annual Report Download - page 78
Download and view the complete annual report
Please find page 78 of the 1997 Volvo annual report below. You can navigate through the pages in the report by either clicking on the pages listed below, or by using the keyword search tool below to find specific information within the annual report.-
 1
1 -
2
-
3
-
4
-
5
-
6
-
7
-
8
-
9
-
10
-
11
-
12
-
13
-
14
-
15
-
16
-
17
-
18
-
19
-
20
-
21
-
22
-
23
-
24
-
25
-
26
-
27
-
28
-
29
-
30
-
31
-
32
-
33
-
34
-
35
-
36
-
37
-
38
-
39
-
40
-
41
-
42
-
43
-
44
-
45
-
46
-
47
-
48
-
49
-
50
-
51
-
52
-
53
-
54
-
55
-
56
-
57
-
58
-
59
-
60
-
61
-
62
-
63
-
64
-
65
-
66
-
67
-
 68
68 -
 69
69 -
 70
70 -
 71
71 -
 72
72 -
 73
73 -
 74
74 -
 75
75 -
 76
76 -
 77
77 -
 78
78 -
 79
79 -
 80
80 -
 81
81 -
 82
82 -
 83
83 -
 84
84 -
 85
85 -
 86
86 -
 87
87 -
 88
88 -
89
-
90
-
91
-
92
-
93
 |
 |

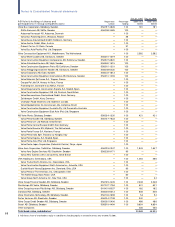
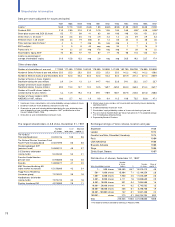
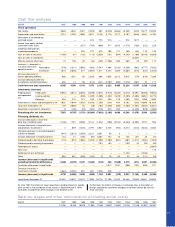
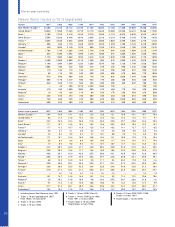
Balance sheets1
SEKM 1987 1988 1989 1990 1991 1992 1993 1994 1995 1996 1997
Assets
Intangible non-recurrent assets 350 297 429 318 373 298 2,284 4,545 5,626 2,277 3,284
Tangible non-current assets 13,373 15,610 19,449 19,897 18,549 20,130 28,157 28,196 27,941 31,426 44,294
Financial non-current assets 12,557 22,066 25,128 30,263 35,277 36,932 33,819 27,467 28,991 25,668 24,527
Non-current assets 26,280 37,973 45,006 50,478 54,199 57,360 64,260 60,208 62,558 59,371 72,105
Inventories 16,561 19,401 18,830 18,316 16,705 18,368 21,390 23,380 23,929 23,148 27,993
Current receivables 12,724 13,945 15,837 15,718 17,065 19,519 27,424 30,545 28,906 31,979 42,594
Marketable securities 17,359 11,264 13,096 12,301 14,477 14,950 13,123 15,878 15,817 21,577 10,962
Cash and bank accounts 5,138 4,368 5,374 5,284 4,302 6,810 8,319 8,571 7,489 5,084 9,641
Current assets 51,782 48,978 53,137 51,619 52,549 59,647 70,256 78,374 76,141 81,788 91,190
Assets 78,062 86,951 98,143 102,097 106,748 117,007 134,516 138,582 138,699 141,159 163,295
Shareholders’ equity and liabilities
Restricted equity 21,198 23,116 23,395 21,476 17,594 15,029 13,622 16,765 16,582 17,224 19,122
Unrestricted equity 8,079 10,124 14,244 13,815 16,270 14,692 13,466 26,567 34,618 40,652 41,309
Shareholders’ equity 29,277 33,240 37,639 35,291 33,864 29,721 27,088 43,332 51,200 57,876 60,431
Minority interests 340 484 414 300 4,986 3,919 6,686 838 605 504 899
Provisions 16,738 20,374 20,011 21,492 18,138 22,953
Non-current liabilities 48,445 53,227 60,090 66,506 67,898 13,822 14,153 11,996 16,885 18,189 24,078
Current liabilities 52,807 66,215 62,405 48,517 46,452 54,934
Shareholders’ equity and depts 78,062 86,951 98,143 102,097 106,748 117,007 134,516 138,582 138,699 141,159 163,295
Assets pledged 1,943 1,997 2,427 2,417 2,641 4,114 4,613 6,527 5,434 6,503 6,743
Contingent liabilities 3,417 3,095 2,986 3,270 4,691 6,808 8,656 7,581 7,450 6,188 5,406
76
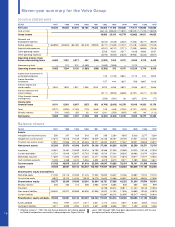
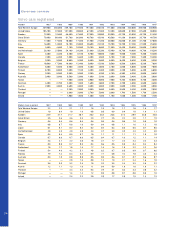
Incom e statem ents1
SEKM 1987 1988 1989 1990 1991 1992 1993 1994 1995 1996 1997
Net sales 92,520 96,639 90,972 83,185 77,223 83,002 111,155 155,866 171,511 156,060 183,625
Cost of sales (66,143) (85,840) (115,092) (128,529) (121,249) (138,990)
Gross income 16,859 25,315 40,774 42,982 34,811 44,635
Research and
development expenses (6,243) (4,438) (4,652) (7,343) (8,271) (8,659)
Selling expenses (86,058) (89,548) (86,155) (82,618) (78,059) (8,717) (11,480) (15,737) (17,418) (14,895) (17,160)
Administrative expenses (4,151) (6,131) (7,711) (7,399) (6,685) (7,018)
Other operating income 3,720 4,102 3,317 4,168 5,086 3,187
Other operating expenses (3,370) (5,455) (6,620) (5,966) (6,336) (6,567)
Operating income (loss)
before nonrecurring items 6,462 7,091 4,817 567 (836) (1,902) 1,913 9,371 9,024 3,710 8,418
Nonrecurring items — 113 313 (2,450) — (1,450) (1,600) — 1,215 — —
Operating income (loss) 6,462 7,204 5,130 (1,883) (836) (3,352) 313 9,371 10,239 3,710 8,418
Income from investments in
associated companies 120 (1,749) 5,861 2,119 314 2,929
Income from other
investments 157 444 1,667 788 9,007 1,168
Interest income and
similar credits 2,549 1,039 1,837 1,556 1,639 3,973 4,250 3,051 3,996 4,817 3,486
Interest expenses and
similar charges (5,111) (5,599) (3,608) (3,757) (3,271) (2,748)
Other financial income
and expenses (536) (301) 36 (337) (374) (77)
Income after
financial items 9,011 8,243 6,967 (327) 803 (4,749) (2,642) 16,378 13,048 14,203 13,176
Taxes (3,272) (3,200) (2,145) (719) (560) 138 (468) (2,783) (3,741) (1,825) (2,705)
Minority interests (74) (103) (35) 26 439 1,291 (356) (365) (45) 99 (112)
Net income 5,665 4,940 4,787 (1,020) 682 (3,320) (3,466) 13,230 9,262 12,477 10,359
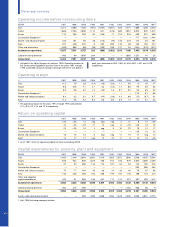
Eleven-year summary for the Volvo Group
1. Effective January 1, 1997, the new Annual Accounts Act is being applied
by Swedish corporations and certain trading companies. Figures for the years 1992 through 1996 have been adjusted to conform with the new
principles and forms of presentation.