Volvo 1997 Annual Report Download - page 82
Download and view the complete annual report
Please find page 82 of the 1997 Volvo annual report below. You can navigate through the pages in the report by either clicking on the pages listed below, or by using the keyword search tool below to find specific information within the annual report.-
 1
1 -
2
-
3
-
4
-
5
-
6
-
7
-
8
-
9
-
10
-
11
-
12
-
13
-
14
-
15
-
16
-
17
-
18
-
19
-
20
-
21
-
22
-
23
-
24
-
25
-
26
-
27
-
28
-
29
-
30
-
31
-
32
-
33
-
34
-
35
-
36
-
37
-
38
-
39
-
40
-
41
-
42
-
43
-
44
-
45
-
46
-
47
-
48
-
49
-
50
-
51
-
52
-
53
-
54
-
55
-
56
-
57
-
58
-
59
-
60
-
61
-
62
-
63
-
64
-
65
-
66
-
67
-
68
-
69
-
70
-
71
-
 72
72 -
 73
73 -
 74
74 -
 75
75 -
 76
76 -
 77
77 -
 78
78 -
 79
79 -
 80
80 -
 81
81 -
 82
82 -
 83
83 -
 84
84 -
 85
85 -
 86
86 -
 87
87 -
 88
88 -
 89
89 -
 90
90 -
 91
91 -
 92
92 -
93
 |
 |

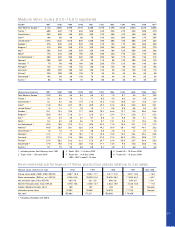
80
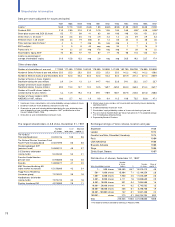
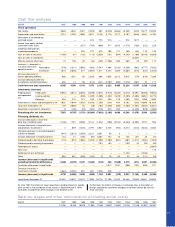
Operating income before nonrecurring item s
SEK M 1987 1988 1989 1990 1991 1992 1993 1994 1995 1996 1997
Cars 4,311 2,680 1,168 (957) (1,597) (1,691) 626 2,771 1,089 1,498 4,510
Trucks 1,606 2,736 2,058 1,114 941 (619) 585 4,051 5,073 878 1,812
Buses 179 286 228 53 (166) 71 313 318 405 331 550
Construction Equipment1— — — — — — — — 717 1,162 1,444
Marine- and industrial engines 223 161 93 20 (113) (76) 125 223 212 (27) 181
Aero 227 240 248 8 202 305 143 60 103 153 472
Other and eliminations (489) 898 (68) (35) (103) 108 121 63 (106) (376) (577)
Automotive operations 6,057 7,001 3,727 203 (836) (1,902) 1,913 7,486 7,493 3,619 8,392
Operations being divested 405 90 1,090 364 — — — 1,885 1,531 91 26
Group total 6,462 7,091 4,817 567 (836)(1,902)1,913 9,371 9,024 3,710 8,418
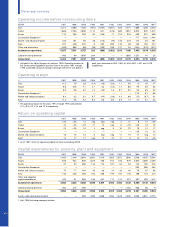
Operating m argin
% 1987 1988 1989 1990 1991 1992 1993 1994 1995 1996 1997
Cars 11.2 7.0 2.8 (2.4) (4.3) (3.8) 1.1 3.8 1.3 1.8 4.7
Trucks 9.0 10.5 7.1 4.1 3.4 (2.4) 1.7 8.8 9.9 2.0 3.6
Buses 8.9 8.5 6.2 1.3 (4.3) 1.6 5.7 5.2 5.3 3.9 5.2
Construction Equipment1— — — — — — — — 12.3 9.1 8.6
Marine and industrial engines 9.4 6.2 3.4 0.7 (4.4) (3.0) 4.2 6.0 5.5 (0.7) 4.1
Aero 11.4 9.6 9.4 0.3 5.5 8.9 3.9 1.7 2.7 3.7 6.3
Return on operating capital
% 1987 1988 1989 1990 1991 1992 1993 1994 1995 1996 1997
Cars >25 >25 14 neg neg neg 4 21 8 12 >25
Trucks 24 >25 >25 21 12 neg 8 >25 >25 10 18
Buses 23 >25 18 4 neg 5 18 22 18 12 17
Construction Equipment — — — — — — — — >25 23 23
Marine and industrial engines 18 16 13 5 neg neg 11 19 17 neg 14
Aero114 17 17 neg 12 22 11 5 13 19 >25
Capital expenditures for property, plant and equipm ent
SEK M 1987 1988 1989 1990 1991 1992 1993 1994 1995 1996 1997
Cars 2,455 2,140 3,594 3,051 1,413 1,562 2,072 1,596 2,540 4,425 5,544
Trucks 628 932 820 1,073 786 912 725 979 2,072 2,589 2,439
Buses 37 92 206 116 114 101 64 54 124 199 276
Construction Equipment — — — — — — — — 204 286 484
Marine and industrial engines 73 77 104 43 36 24 35 96 79 67 86
Aero 146 240 490 156 258 199 157 170 180 173 413
Other and corporate
capital expenditures 243 51 608 159 267 117 412 227 387 403 612
Automotive operations 3,582 3,532 5,822 4,598 2,874 2,915 3,465 3,122 5,586 8,142 9,854
Operations being divested 282 416 459 — — — — 1,152 905 58 9
Group total 3,864 3,948 6,281 4,598 2,874 2,915 3,465 4,274 6,491 8,200 9,863
Assets under operational leasing1— — 400 1,200 1,000 1,352 1,678 2,495 2,585 3,851 9,773
Eleven-year summary
1 Included in the Volvo Group as of mid-year 1995. Operating income for
the Construction Equipment business area in the years 1991 through
1995, calculated using the average exchange rate for the U.S. dollar in
each year, amounted to SEK (193) M, (436), 502, 1,621 and 1,679
respectively.
1 The operating margin for the years 1991 through 1995 amounted to
(2.3), (5.5), 5.2, 13.4 and 12.3 respectively.
1 As of 1997, return on operating capital for Aero is excluding AGES.
1 Until 1996 including company vehicles.