Volvo 1997 Annual Report Download - page 18
Download and view the complete annual report
Please find page 18 of the 1997 Volvo annual report below. You can navigate through the pages in the report by either clicking on the pages listed below, or by using the keyword search tool below to find specific information within the annual report.-
 1
1 -
2
-
3
-
4
-
5
-
6
-
7
-
 8
8 -
 9
9 -
 10
10 -
 11
11 -
 12
12 -
 13
13 -
 14
14 -
 15
15 -
 16
16 -
 17
17 -
 18
18 -
 19
19 -
 20
20 -
 21
21 -
 22
22 -
 23
23 -
 24
24 -
 25
25 -
 26
26 -
 27
27 -
 28
28 -
29
-
30
-
31
-
32
-
33
-
34
-
35
-
36
-
37
-
38
-
39
-
40
-
41
-
42
-
43
-
44
-
45
-
46
-
47
-
48
-
49
-
50
-
51
-
52
-
53
-
54
-
55
-
56
-
57
-
58
-
59
-
60
-
61
-
62
-
63
-
64
-
65
-
66
-
67
-
68
-
69
-
70
-
71
-
72
-
73
-
74
-
75
-
76
-
77
-
78
-
79
-
80
-
81
-
82
-
83
-
84
-
85
-
86
-
87
-
88
-
89
-
90
-
91
-
92
-
93
 |
 |

16
Board of Directors’ report
Minority interests
Minority interests in the Volvo Group consist mainly of the Henly Group’s
49% interest in Prévost Car Inc, Hitachi Construction Machinery’s 40% interest
in Euclid-Hitachi Heavy Equipment Inc and GPA Group’s 40% interest in
The AGES Group ALP.
Financial position
The Group’s total assets increased by SEK 22.1 billion. Excluding foreign
exchange movements, acquisitions of companies and the expansion of sales-
financing operations, total assets decreased by SEK 8.5 billion. During the year
Volvo sold all of its shares in Renault, which together with the sale of the hold-
ing in Pripps Ringnes reduced the long-term financial assets by SEK 7.9 billion.
Excluding exchange rate movements and acquisitions of companies, inventories
rose SEK 2.6 billion.
Sales Financing
Total assets in Volvo’s sales finance operations more than doubled during the
year, to SEK 46.9 billion (22.7). The increase was due largely to the fact that
sales-financing companies in North America and Great Britain, in which Volvo
had formerly been a joint owner, are now being operated by the Group as wholly
owned subsidiaries. Customer and leasing receivables amounted to SEK 32.1 bil-
lion (13.4). Assets in operational leasing increased from SEK 4.9 billion to
SEK 12.1 billion. The equity/assets ratio in sales-financing operations was 9.1%
in 1997, calculated as a percentage of equity and minority capital.
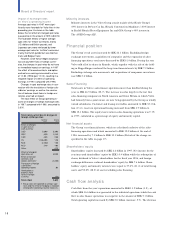
Net financial assets
The Group’s net financial assets, which are calculated exclusive of the sales-
financing operations and which amounted to SEK 12.0 billion at the end of
1996, increased by 7.1 billion to SEK 19.1 billion (Details of the change are
specified in the table on page 17).
Shareholders’ equity
Shareholders’ equity increased by SEK 2.6 billion in 1997. Net income for the
year increased shareholders’ equity by SEK 10.4 billion while the redemption of
shares, dividend to Volvo’s shareholders for the fiscal year 1996, and foreign
exchange differences, reduced shareholders’ equity by SEK 7.6 billion. Share-
holders’ equity and minority interests were equal to 37.6% (41.4) of total Group
assets and 50.8% (48.0) of assets excluding sales financing.
Cash flow analysis
Cash flow from the year’s operations amounted to SEK 11.5 billion (3.5), of
which SEK 16.6 billion was generated in the industrial operations while the cash
flow in sales finance operations was negative in the amount of SEK 5.1 billion.
Total operating capital increased by SEK 2.0 billion (increase: 5.9). The decrease
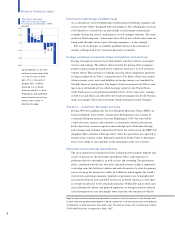
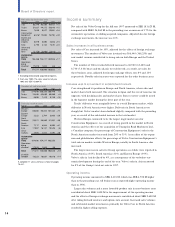
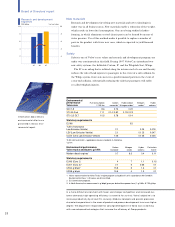
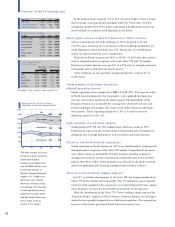
Impact of exchange rates
on Volvo’s operating incom e
Average spot rates in 1997 were signi-
ficantly more favorable for Volvo than in the
preceding year. As shown in the table
below, the net effect of changed spot rates
was positive in the amount of SEK 4,830 M.
The favorable effects of higher average
spot rates for “inflow” currencies, mainly
U.S. dollars and British pounds, and
Japanese yen, were reinforced by lower
average spot rates for “outflow” currencies:
mainly the Dutch guilder but also German
mark and Belgian franc.
However, since Volvo hedges large por-
tions of payment flows in foreign curren-
cies, the changes in spot rates do not have
an immediate impact on earnings. In 1997
the effect of forward contracts and option
contracts on earnings amounted to a loss
of 1,180 (1996:gain 1,100), resulting in a
negative impact of 2,280 on operating
earnings in 1997, compared with 1996.
Changes in spot exchange rates in con-
nection with the translation of foreign sub-
sidiaries’ earnings, as well as the revalua-
tion of balance sheet items in foreign cur-
rencies, also had an impact.
The total effect on Group operating in-
come of changes in foreign exchange rates
in 1997, compared with 1996, amounted to
2,600.
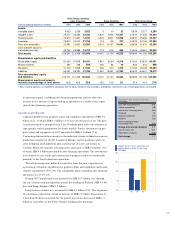
Total income effect due to changes in
foreign exchange rates
Net flow Income
1997 effect
Effect of changes
in spot rates in
each currency
USD 2,600 2,390
GBP 650 1,310
CAD 430 250
ITL 1,195,400 170
NLG (2,230) 140
AUD 240 100
Other 470
Effect of changed
spot rates, net 4,830
Effect of forward
contracts and
options contracts1(2,280)
Translation of foreign
subsidiaries’
operating income 80
Revaluation of
balance sheet
items in foreign
currency (30)
Total effect 2,600
1 Group sales are reported at average spot
rates and the effect of hedging is included
among other operating income/ expenses.