Volvo 1997 Annual Report Download - page 42
Download and view the complete annual report
Please find page 42 of the 1997 Volvo annual report below. You can navigate through the pages in the report by either clicking on the pages listed below, or by using the keyword search tool below to find specific information within the annual report.-
 1
1 -
2
-
3
-
4
-
5
-
6
-
7
-
8
-
9
-
10
-
11
-
12
-
13
-
14
-
15
-
16
-
17
-
18
-
19
-
20
-
21
-
22
-
23
-
24
-
25
-
26
-
27
-
28
-
29
-
30
-
31
-
 32
32 -
 33
33 -
 34
34 -
 35
35 -
 36
36 -
 37
37 -
 38
38 -
 39
39 -
 40
40 -
 41
41 -
 42
42 -
 43
43 -
 44
44 -
 45
45 -
 46
46 -
 47
47 -
 48
48 -
 49
49 -
 50
50 -
 51
51 -
 52
52 -
53
-
54
-
55
-
56
-
57
-
58
-
59
-
60
-
61
-
62
-
63
-
64
-
65
-
66
-
67
-
68
-
69
-
70
-
71
-
72
-
73
-
74
-
75
-
76
-
77
-
78
-
79
-
80
-
81
-
82
-
83
-
84
-
85
-
86
-
87
-
88
-
89
-
90
-
91
-
92
-
93
 |
 |
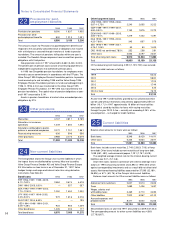
40
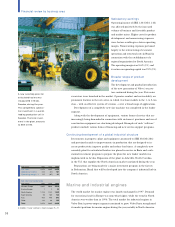
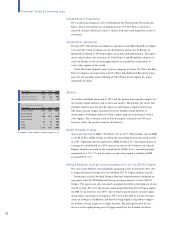
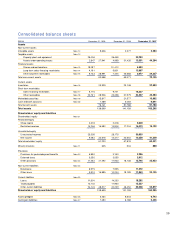
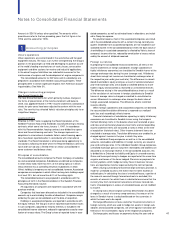
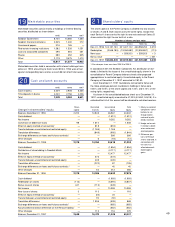
Cash flow analyses
SEK M 1995 1996 1997
Year’s operations
Net income 9,262 12,477 10,359
Depreciation and amortization 5,656 5,351 6,796
Write-down of shareholdings and fixed assets 1,817 — —
Income from investments in associated companies after taxes (730) (222) 220
Dividends received from associated companies 404 119 145
Gain on sales of securities (1,180) (8,169) (4,068)
Gain on sales of subsidiaries (3,032) — —
Minority interests after taxes 45 (99) 112
Increase in current assets:
Receivables (962) (4,777) (7,452)
Inventories (516) (547) (2,575)
Increase (decrease) in current operating liabilities
and other provisions 570 (618) 7,280
Increase (decrease) in deferred tax liabilities (267) (1,175) 23 (5,919) 711 (2,036)
Cash flow from year’s operations 11,067 3,538 11,528
Investments (increase)
Property, plant and equipment, etc:
Capital expenditures for property, plant and equipment (6,491) (8,200) (9,863)
Investments in leasing vehicles (2,585) (3,851) (9,773)
Disposals 1,351 1,958 1,855
Investments in shares, net 1,953 14,080 10,669
Long-term receivables, net (1,953) (2,804) (6,031)
Acquisitions and sales of companies (4,420) (12,145) (878) 305 (1,303) (14,446)
Remaining after net investments (1,078) 3,843 (2,918)
Financing, dividends, etc
Increase (decrease) in short-term bank loans
and other loans (3,993) 5,151 995
Increase (decrease) in long-term loans
and provisions for pensions 6,166 (1,844) 3,404
Increase (decrease) in minority interests (37) 45 (21)
Dividends paid to AB Volvo shareholders (1,512) (1,854) (1,993)
Dividends paid to minority shareholders (3) (33) (83)
Redemption of shares – – (5,807)
New issue of shares – – 116
Settlement of loan to Renault — (1,536) —
Other 46 667 (121) (192) (22) (3,411)
Increase (decrease) in liquid funds
excluding translation differences (411) 3,651 (6,329)
Translation differences on liquid funds (732) (296) 271
Increase (decrease) in liquid funds (1,143) 3,355 (6,058)
Liquid funds, January 1 24,449 23,306 26,661
Liquid funds, December 31 23,306 26,661 20,603
In the Cash flow analyses, the effects of major acquistions and divestments
of subsidiaries in each year, including the distribution of the shareholding in
Swedish Match in 1996, have been excluded from other changes in the
balance sheet. The effects of changes in foreign exchange rates at transla-
tion of foreign subsidiaries have been excluded, since they do not affect
cash flow. Liquid funds include Cash and bank accounts and Marketable
securities.
Volvo Group