Volvo 1997 Annual Report Download - page 55
Download and view the complete annual report
Please find page 55 of the 1997 Volvo annual report below. You can navigate through the pages in the report by either clicking on the pages listed below, or by using the keyword search tool below to find specific information within the annual report.-
 1
1 -
2
-
3
-
4
-
5
-
6
-
7
-
8
-
9
-
10
-
11
-
12
-
13
-
14
-
15
-
16
-
17
-
18
-
19
-
20
-
21
-
22
-
23
-
24
-
25
-
26
-
27
-
28
-
29
-
30
-
31
-
32
-
33
-
34
-
35
-
36
-
37
-
38
-
39
-
40
-
41
-
42
-
43
-
44
-
 45
45 -
 46
46 -
 47
47 -
 48
48 -
 49
49 -
 50
50 -
 51
51 -
 52
52 -
 53
53 -
 54
54 -
 55
55 -
 56
56 -
 57
57 -
 58
58 -
 59
59 -
 60
60 -
 61
61 -
 62
62 -
 63
63 -
 64
64 -
 65
65 -
66
-
67
-
68
-
69
-
70
-
71
-
72
-
73
-
74
-
75
-
76
-
77
-
78
-
79
-
80
-
81
-
82
-
83
-
84
-
85
-
86
-
87
-
88
-
89
-
90
-
91
-
92
-
93
 |
 |
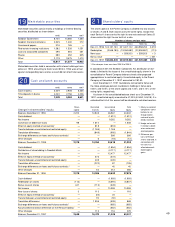
53
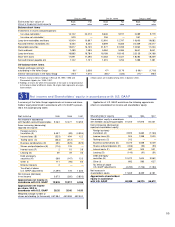
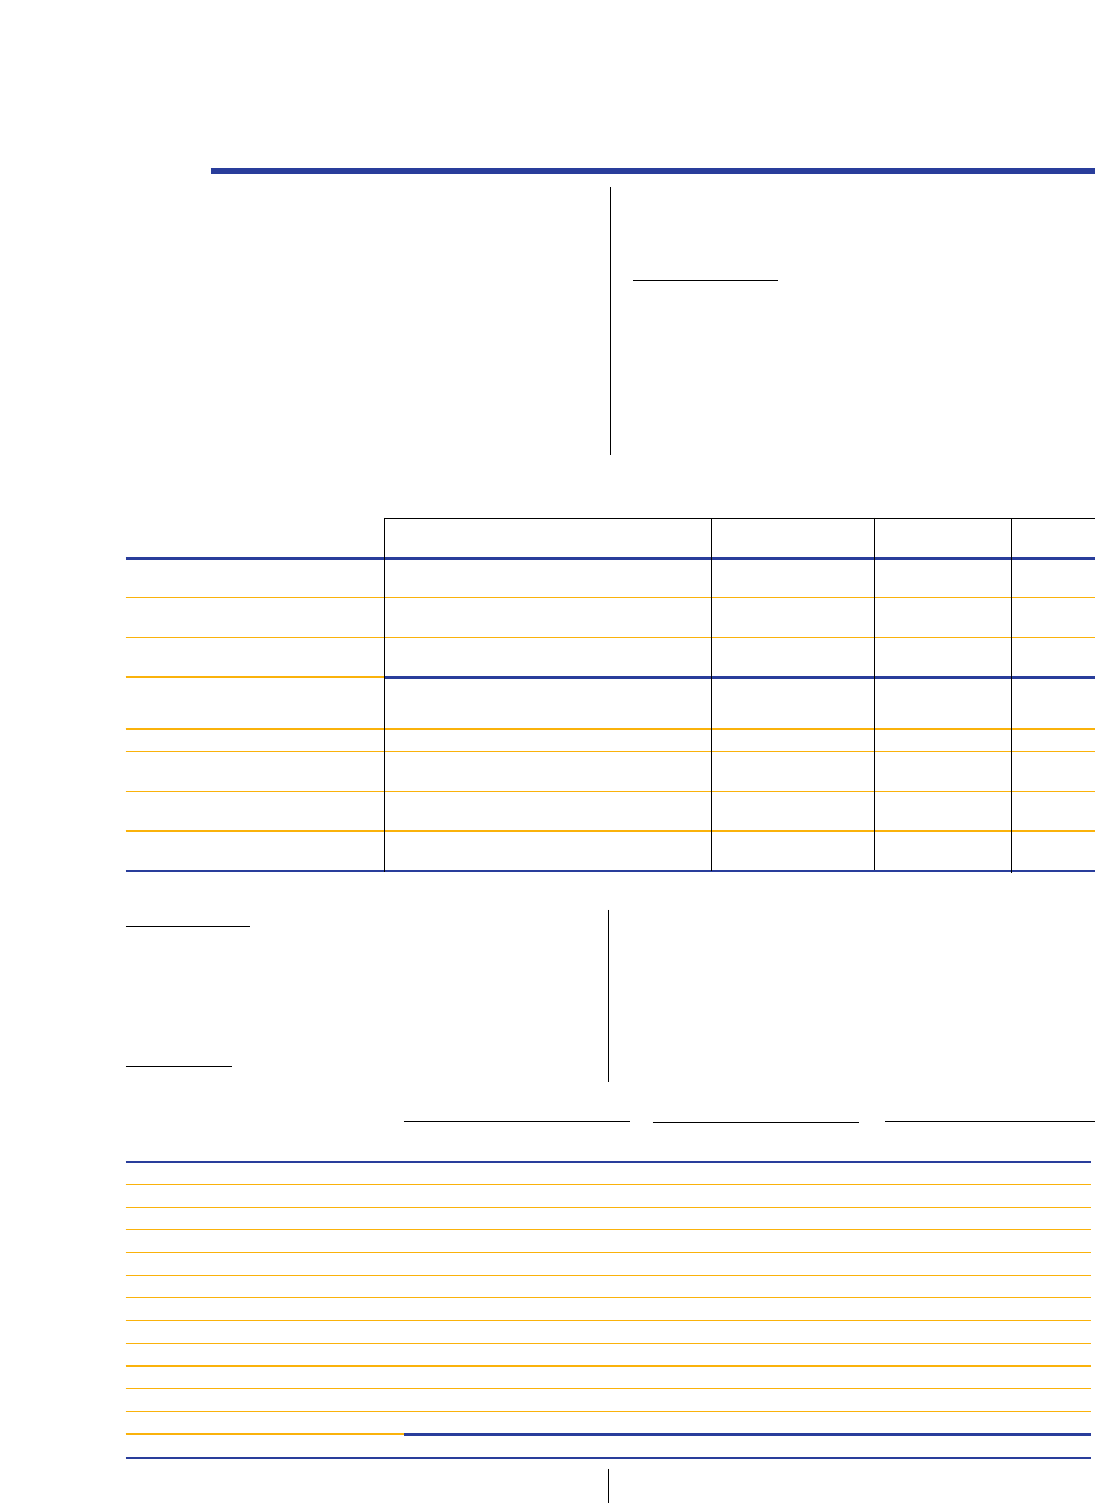
In the course of its operations the Volvo Group is exposed to various
types of financial risks. Group-wide policies form the basis for each
Group company’s action program. Monitoring and control is conduc-
ted continuously in each company as well as centrally. Most of the
Volvo Group’s financial transactions are carried out through Volvo’s
in-house bank, Volvo Group Finance, which conducts its operations
within established risk mandates and limits.
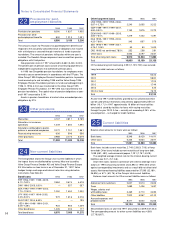
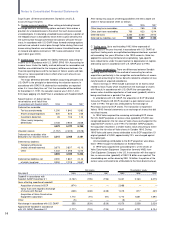
Foreign exchange risk
Volvo’s currency risk is related to changes in contracted and project-
ed flows of payments (commercial exposure), to payment flows relat-
ed to loans and investments (financial exposure), and to the revalua-
tion of assets and liabilities in foreign subsidiaries (equity exposure).
The objective of Volvo’s foreign exchange risk management is to
reduce the impact of foreign exchange movements on the Group’s
income and financial position.
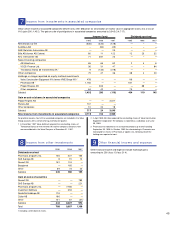
Commercial exposure
Volvo uses forward exchange contracts and currency options to hedge
the value of future payment flows. Contracts related to hedging of
anticipated sales and purchases of foreign currency normally do not
exceed 36 months. In accordance with the Group’s currency policy,
between 40% and 80% of the net flow in each currency is hedged
for the coming 12 months, 20% to 60% for months 13 through 24
and 0% to 40% for months 25 through 36. The value of all forward
and options contracts as of December 31, 1997 was SEK 51.9 billi-
on (40.2; 41.0).
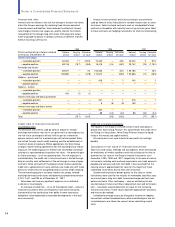
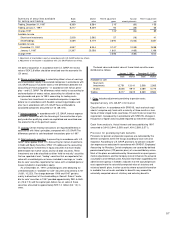
Inflow currencies Outflow currencies Other currencies Total
Net expressed in
SEK M USD GBP ITL JPY DEM BEF SEK
Due date 1998 amount 2,281 487 933,459 41,741 (1,212) (19,011) 4,654
rate17.38 11.64 0.0043 0.0838 4.64 0.2186
Due date 1999 amount 1,526 351 368,888 34,489 (768) (7,823) 3,036
rate17.53 12.20 0.0044 0.0697 4.53 0.2167
Due date 2000 amount 625 215 24,500 17,230 (147) (1,705) 952
rate17.68 12.43 0.0045 0.0694 4.40 0.2155
Total 4,432 1,053 1,326,847 93,460 (2,127) (28,539) 8,642
of which options contracts 355 72 4,341 15,974 (273) 0 260
Translated to actual value, SEK233,128 12,647 5,792 7,253 (9,884) (6,222) 9,234 51,948
Translated to SEK a year-end
1997 rates 34,887 13,814 5,904 5,664 (9,351) (6,082) 8,642 53,478
Difference between actual value
and year-end exchange rates (1,759) (1,167) (112) 1,589 (533) (140) 592 (1,530)
Year-end exchange rates,
December 31, 1997 7.87 13.12 0.0045 0.0606 4.40 0.2131
■■
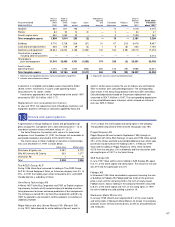
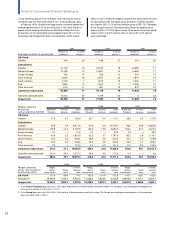
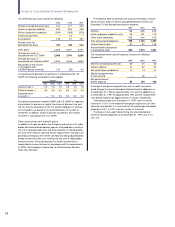
30 Financial risks
1995 1996 1997
Total outstanding currency Notional Carrying Estimated Notional Carrying Estimated Notional Carrying Estimated
contracts, December 31 amount amount fair value amount amount fair value amount amount fair value
Foreign exchange contracts
– receivable position 127,290 5,771 8,320 56,238 3,388 3,492 40,349 1,951 2,006
– payable position 261,736 (5,669) (6,956) 50,303 (3,377) (1,477) 84,591 (2,150) (3,762)
Foreign exchange swaps
– receivable position 4,652 — 49 83,301 4 2,623 27,268 — 1,416
– payable position 123 — (1) 81,565 (1) (2,517) 26,045 — (1,604)
Options – purchased
– receivable position 13,558 21 1,255 11,163 33 1,075 5,135 — 379
– payable position 802 (23) (23) 34 — — 4,156 — (147)
Options – written
– receivable position 27 — — — — — 2,080 — 57
– payable position 7,235 (4) (36) 5,806 — (17) 4,274 — (61)
Total 96 2,608 47 3,179 (199) (1,716)
1 Average contract rate. 2 Average forward contract rate and, for options, the most favorable of the year-end rate and contract rate.
Volvo Group outstanding currency contracts pertaining to com m ercial exposure, Decem ber 31, 1997
The table shows contracts hedging
future flows of commercial payments.
Financial exposure
Group companies operate in local currencies. Through loans and
investments being mainly in the local currency, financial exposure is
avoided. In companies which have loans and investments in foreign
currencies, hedging is carried out in accordance with Volvo’s financial
policy, which means a limited risk-taking.
Equity exposure
In conjunction with translation of the Group’s assets and liabilities in
foreign subsidiaries to Swedish kronor, a risk arises that the currency
rate will have an effect on the consolidated balance sheet. In accord-
ance with the Group’s currency policy, net assets (shareholders’
equity) in foreign subsidiaries and associated companies are hedged
up to 50%. Hedging is mainly done through borrowing in the same
currency as the net assets. At year-end 1997, net assets in subsidia-
ries and associated companies outside Sweden amounted SEK 25
billion, of which 17% was hedged.
The notional amount of the derivative contracts represents the gross contract
amount outstanding. To determine the estimated fair value, the major part of
the outstanding contracts have been marked-to-market. Discounted cash flows
has been used in some cases.