Volvo 1997 Annual Report Download - page 84
Download and view the complete annual report
Please find page 84 of the 1997 Volvo annual report below. You can navigate through the pages in the report by either clicking on the pages listed below, or by using the keyword search tool below to find specific information within the annual report.-
 1
1 -
2
-
3
-
4
-
5
-
6
-
7
-
8
-
9
-
10
-
11
-
12
-
13
-
14
-
15
-
16
-
17
-
18
-
19
-
20
-
21
-
22
-
23
-
24
-
25
-
26
-
27
-
28
-
29
-
30
-
31
-
32
-
33
-
34
-
35
-
36
-
37
-
38
-
39
-
40
-
41
-
42
-
43
-
44
-
45
-
46
-
47
-
48
-
49
-
50
-
51
-
52
-
53
-
54
-
55
-
56
-
57
-
58
-
59
-
60
-
61
-
62
-
63
-
64
-
65
-
66
-
67
-
68
-
69
-
70
-
71
-
72
-
73
-
 74
74 -
 75
75 -
 76
76 -
 77
77 -
 78
78 -
 79
79 -
 80
80 -
 81
81 -
 82
82 -
 83
83 -
 84
84 -
 85
85 -
 86
86 -
 87
87 -
 88
88 -
 89
89 -
 90
90 -
 91
91 -
 92
92 -
 93
93
 |
 |

82
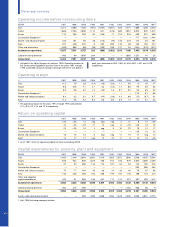
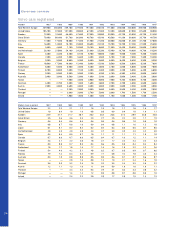
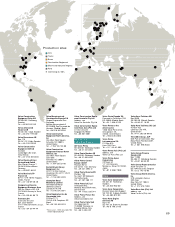
Employees
Number 1987 1988 1989 1990 1991 1992 1993 1994 1995 1996 1997
Sweden 55,440 54,970 54,740 47,260 42,960 39,130 43,980 44,880 47,000 43,330 43,650
Europe, excluding Sweden 11,870 14,530 14,180 12,180 11,630 12,040 16,280 18,040 16,930 15,290 16,100
North America 4,880 5,680 6,040 5,720 5,320 5,540 6,950 6,100 7,860 6,900 8,450
South America 1,350 1,890 2,010 1,940 1,730 1,520 3,400 3,400 3,620 2,130 2,000
Asia 640 850 1,030 1,270 1,460 1,380 2,170 2,380 2,830 2,260 1,720
Other markets 1,170 690 690 430 480 510 860 750 810 420 980
Group total 75,350 78,610 78,690 68,800 63,580 60,120 73,640 75,550 79,050 70,330 72,900
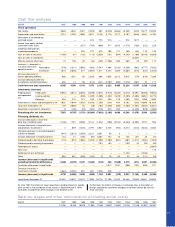
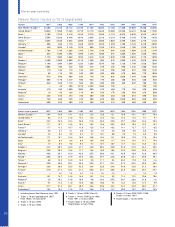
Operating statistics
Num ber of invoiced Volvo vehicles
1987 1988 1989 1990 1991 1992 1993 1994 1995 1996 1997
Large cars 290,900 278,370 271,800 237,350 200,850 214,110 216,710 255,800 293,540 269,200 272,290
Medium-size cars 118,500 120,100 127,200 118,800 97,100 93,200 85,400 95,200 81,100 99,050 114,150
Total, cars 409,400 398,470 399,000 356,150 297,950 307,310 302,110 351,000 374,640 368,250 386,440
Heavy trucks 41,200 53,000 53,000 50,700 47,600 43,000 47,200 63,600 71,400 59,100 63,900
Medium-heavy trucks 6,500 6,500 6,200 5,000 6,200 5,100 4,000 4,900 5,100 4,600 5,100
Total, trucks 47,700 59,500 59,200 55,700 53,800 48,100 51,200 68,500 76,500 63,700 69,000
Buses and bus chassis 3,920 5,120 5,550 4,830 4,650 5,580 5,450 5,770 6,830 7,410 8,730
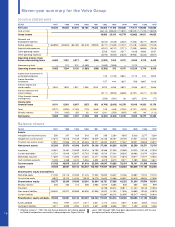
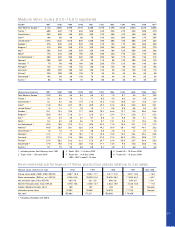
Eleven-year summary
1987 1988 1989 1990 1991 1992 1993 1994 1995 1996 1997
Cars Total Europe 271,000 275,670 261,310 231,890 199,880 205,270 179,560 214,950 225,160 224,890 239,960
Western Europe 271,000 275,670 261,310 231,890 199,880 199,610 170,850 208,280 219,340 219,980 234,050
Eastern Europe — — — — — 5,660 8,710 6,670 5,820 4,910 5,910
North America 117,790 100,910 111,020 93,270 69,290 75,400 80,110 90,820 99,230 95,660 101,980
South America — — — — 620 210 720 1,860 2,840 950 2,280
Asia 10,150 12,470 15,120 21,250 20,520 23,130 35,330 37,690 42,130 40,280 36,170
Other markets 10,460 9,420 11,550 9,740 7,640 3,300 6,390 5,680 5,280 6,470 6,050
Total 409,400 398,470 399,000 356,150 297,950 307,310 302,110 351,000 374,640 368,250 386,440
Trucks Total Europe 27,650 31,310 31,300 28,700 27,000 22,200 17,100 27,000 34,160 34,970 34,460
Western Europe 27,420 30,960 30,550 27,980 25,800 21,250 16,240 25,450 32,330 32,310 31,030
Eastern Europe 230 350 750 720 1,200 950 860 1,550 1,830 2,660 3,430
North America 13,180 21,530 20,150 16,460 13,380 16,720 21,860 26,460 27,090 16,850 20,900
South America 3,300 3,290 3,630 3,980 3,480 3,590 5,900 8,320 7,800 4,980 6,970
Asia 2,120 1,670 2,210 4,610 8,100 4,120 4,840 4,830 5,270 4,850 4,710
Other markets 1,450 1,670 1,910 1,970 1,800 1,500 1,530 1,890 2,170 2,030 1,940
Total 47,700 59,470 59,200 55,720 53,760 48,130 51,230 68,500 76,490 63,680 68,980
Buses Total Europe 3,830 2,970 2,430 2,360 2,610 3,040 3,570 3,840 4,190
Western Europe 3,740 2,940 2,410 2,320 2,520 2,900 3,510 3,770 4,030
Eastern Europe 90 30 20 40 90 140 60 70 160
North America 70 30 — 10 30 10 340 750 1,110
South America 970 1,070 1,340 1,780 1,320 1,630 1,510 1,460 1,350
Asia 240 270 640 1,270 1,050 780 920 1,060 1,410
Other markets 440 490 240 160 440 310 490 300 670
Total 3,920 5,120 5,550 4,830 4,650 5,580 5,450 5,770 6,830 7,410 8,730
Effective in 1997, the Volvo Group’s accounting per market area reflects new
geographical definitions, based on ISO standard. Values for the years 1991–1996 has been adjusted to confirm with the new principle.