Volvo 1997 Annual Report Download - page 85
Download and view the complete annual report
Please find page 85 of the 1997 Volvo annual report below. You can navigate through the pages in the report by either clicking on the pages listed below, or by using the keyword search tool below to find specific information within the annual report.-
 1
1 -
2
-
3
-
4
-
5
-
6
-
7
-
8
-
9
-
10
-
11
-
12
-
13
-
14
-
15
-
16
-
17
-
18
-
19
-
20
-
21
-
22
-
23
-
24
-
25
-
26
-
27
-
28
-
29
-
30
-
31
-
32
-
33
-
34
-
35
-
36
-
37
-
38
-
39
-
40
-
41
-
42
-
43
-
44
-
45
-
46
-
47
-
48
-
49
-
50
-
51
-
52
-
53
-
54
-
55
-
56
-
57
-
58
-
59
-
60
-
61
-
62
-
63
-
64
-
65
-
66
-
67
-
68
-
69
-
70
-
71
-
72
-
73
-
74
-
 75
75 -
 76
76 -
 77
77 -
 78
78 -
 79
79 -
 80
80 -
 81
81 -
 82
82 -
 83
83 -
 84
84 -
 85
85 -
 86
86 -
 87
87 -
 88
88 -
 89
89 -
 90
90 -
 91
91 -
 92
92 -
 93
93
 |
 |

83
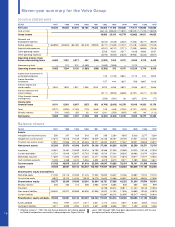
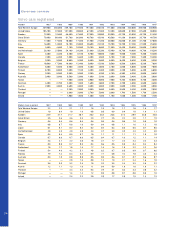
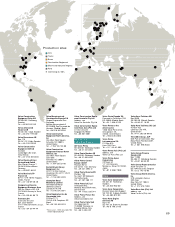
Manufactured Volvo trucks
Number 1987 1988 1989 1990 1991 1992 1993 1994 1995 1996 1997
Volvo Truck Corporation,
Tuve Plant, Sweden 14,200 14,400 14,500 12,700 13,800 9,060 8,660 11,730 14,340 14,890 13,660
Volvo Europe Truck NV, Belgium 13,800 17,200 17,300 15,500 16,400 12,700 11,060 17,920 21,150 19,790 21,210
Volvo Trucks (Great Britain)Ltd,
Great Britain 2,480 3,660 3,530 2,430 1,950 2,310 2,520 3,190 3,930 2,590 2,270
Volvo Truck Poland Co, Poland — — — — — — — 500 930 1,010 1,280
Volvo Trucks North America Inc.
United States 11,470 19,990 19,120 15,860 13,480 17,120 21,930 26,450 27,630 16,630 20,760
GM Planta Motores y Fundición Toluca,
Mexico1– – – – — – – – – 60 330
Volvo do Brasil, Brazil 2,820 3,190 3,220 3,560 2,600 2,390 4,220 6,010 5,740 3,710 5,080
Volvo del Peru SA, Peru 840 540 310 370 450 190 350 590 620 190 400
General Motors Colmotores SA, Colombia1— — — 180 220 480 850 1,180 600 490 1,660
Volvo Australia Pty Ltd, Australia 450 830 1,120 1,020 580 700 630 1,040 1,150 820 670
SAIDA/ Star Auto, Marocco1190 330 360 620 190 520 210 310 430 210 310
Magrimex, GPI Km Route de Sousse,
Tunisia1– – – – — – – – – – 100
Swedish Motor
Corporation Pty Ltd, Botswana1— — — — — — — 40 480 770 470
Swedish Motor Assembly, Malaysia — — 40 — — — 30 210 350 600 510
Zamyad Co Ltd, Iran140 — 400 2,470 3,190 940 480 — 20 950 900
Volvo Pakistan Ltd, Pakistan – – – – — – – – – – 110
Assembled in other markets 210 360 300 190 140 60 — 20 40 40 –
Total Volvo trucks 46,500 60,500 60,200 54,900 53,000 46,470 50,940 69,190 77,410 62,750 69,720
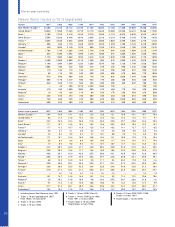
Manufactured Volvo cars
Number 1987 1988 1989 1990 1991 1992 1993 1994 1995 1996 1997
Volvo Cars Europe Industry, Belgium 88,500 91,000 94,000 83,400 69,500 77,300 102,700 147,600 144,100 144,300 145,200
Volvo Car Corporation, Torslanda Body
and Assembly Plant, Sweden 165,700 150,400 139,600 121,000 73,900 82,100 72,800 93,700 132,200 113,200 114,100
NedCar, the Netherlands1124,800 115,000 133,200 121,300 84,500 94,000 80,200 92,100 79,600 101,700 115,000
Volvo Canada Ltd, Canada 8,500 6,650 8,300 8,100 7,700 6,300 5,500 6,700 6,900 7,000 7,100
Volvo Car Corporation, Uddevalla
Assembly Plant/ Auto Nova AB, Sweden1700 1,900 9,200 16,100 19,100 21,800 4,400 — 100 1,750 2,000
Thai Swedish Assembly Co. Ltd, Thailand 1,300 1,800 2,200 3,100 3,500 3,600 5,000 3,600 4,700 4,300 1,300
Swedish Motor Assemblies
Sdn Bhd, Malaysia 200 1,100 1,800 2,450 1,600 1,600 500 2,300 2,100 2,900 1,850
PTISMAC, Indonesia1200 400 300 550 400 — 300 700 800 550 700
Star Motors, The Philippines1— — — — — — — — — 100 150
Volvo Car Corporation, Kalmar
Assembly Plant, Sweden 29,100 28,000 23,400 18,800 18,100 17,500 19,300 5,000 — — —
Assembled in other markets 4,800 4,350 2,000 1,300 — — — — — — —
Total Volvo cars 423,800 400,600 414,000 376,100 278,300 304,200 290,700 351,700 370,500 375,800 387,400
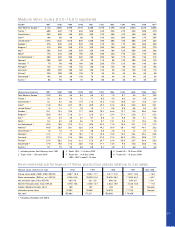
Manufactured buses and bus chassis
Number 1987 1988 1989 1990 1991 1992 1993 1994 1995 1996 1997
Volvo Bus Corporation,
Borås Plant, Sweden 2,490 2,800 2,820 2,170 2,250 2,900 2,830 3,110 3,620 3,370 3,870
Volvo Truck & Bus Assembly,
Great Britain – 1,330 1,230 840 760 550 890 1,020 920 1,550 1,860
Volvo do Brasil, Brazil 690 800 830 1,070 1,230 1,980 1,020 1,290 1,390 1,370 1,620
Volvo del Peru SA, Peru 80 210 210 100 90 80 90 160 180 40 10
Prévost Car Inc., Canada – – – – – – – — 330 700 880
Xian Silver Bus, China1– – – – – – – — 90 230 320
Volvo Australia Pty Ltd, Australia 140 140 120 90 80 110 90 100 40 – —
Assembled in other markets 530 220 350 390 300 40 120 90 300 180 370
Total buses
and bus chassis 3,930 5,500 5,560 4,660 4,710 5,660 5,040 5,770 6,870 7,440 8,930
1 Volvo has owned or currently owns between 0% to 50%.