Volvo 1997 Annual Report Download - page 88
Download and view the complete annual report
Please find page 88 of the 1997 Volvo annual report below. You can navigate through the pages in the report by either clicking on the pages listed below, or by using the keyword search tool below to find specific information within the annual report.-
 1
1 -
2
-
3
-
4
-
5
-
6
-
7
-
8
-
9
-
10
-
11
-
12
-
13
-
14
-
15
-
16
-
17
-
18
-
19
-
20
-
21
-
22
-
23
-
24
-
25
-
26
-
27
-
28
-
29
-
30
-
31
-
32
-
33
-
34
-
35
-
36
-
37
-
38
-
39
-
40
-
41
-
42
-
43
-
44
-
45
-
46
-
47
-
48
-
49
-
50
-
51
-
52
-
53
-
54
-
55
-
56
-
57
-
58
-
59
-
60
-
61
-
62
-
63
-
64
-
65
-
66
-
67
-
68
-
69
-
70
-
71
-
72
-
73
-
74
-
75
-
76
-
77
-
 78
78 -
 79
79 -
 80
80 -
 81
81 -
 82
82 -
 83
83 -
 84
84 -
 85
85 -
 86
86 -
 87
87 -
 88
88 -
 89
89 -
 90
90 -
 91
91 -
 92
92 -
 93
93
 |
 |

86
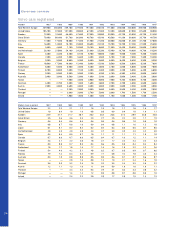
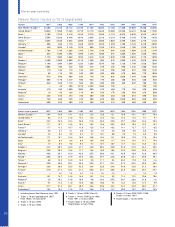
Market share in percent 1987 1988 1989 1990 1991 1992 1993 1994 1995 1996 1997
Western Europe 1, 3 14.4 14.0 14.1 12.9 12.5 12.0 12.1 15.8 16.1 16.7 15.3
United States 58.3 11.5 12.0 12.2 12.3 12.3 12.3 12.4 11.6 9.1 9.7
Brazil 423.2 23.3 23.4 26.8 21.6 26.9 29.0 29.7 28.8 24.3 23.3
Great Britain 417.7 16.7 16.5 16.2 18.2 19.5 20.2 20.3 18.9 19.2 16.7
France 811.7 11.2 10.7 11.0 12.5 11.9 10.3 14.1 13.7 13.7 13.5
Germany 33.5 3.7 4.1 4.0 6.2 4.7 3.6 5.0 6.9 8.5 7.5
Canada52.2 8.4 9.9 9.7 9.7 10.1 8.8 7.8 7.5 6.5 9.5
the Netherlands 317.1 16.1 16.4 16.0 16.8 16.4 14.1 18.3 17.5 17.8 18.4
Spain 6.8 8.4 9.8 8.0 10.5 10.5 11.7 14.2 13.9 14.7 14.0
Italy 37.7 8.5 9.0 9.3 9.7 10.7 10.7 12.7 13.4 13.5 13.2
Sweden 347.2 50.7 46.9 47.7 44.0 50.4 49.0 51.9 51.5 46.1 49.2
Belgium 320.0 20.2 19.6 17.7 19.6 18.9 18.6 23.3 25.0 24.0 21.3
Norway 340.8 39.1 42.9 42.0 35.5 38.0 43.1 48.5 46.0 42.6 40.9
Poland 738.5 36.5 27.9 23.9 20.3 29.7 34.5 53.0 35.1 39.8 29.1
Turkey 96.0 14.9 16.9 14.5 8.5 11.7 8.4 33.4 17.0 9.4 n.a.
Denmark 429.0 33.5 35.1 33.6 29.9 31.7 33.7 37.2 34.2 35.9 25.2
Portugal 338.9 36.6 35.5 32.5 34.8 33.8 34.6 34.6 33.8 31.3 28.4
Finland331.0 31.4 32.4 31.4 30.0 32.1 30.5 34.5 36.6 35.7 32.7
Iran9— n.a. n.a. n.a. n.a. n.a. n.a. — — n.a. n.a
Australia 210.1 14.7 14.5 14.6 16.1 12.4 9.3 11.4 12.2 10.6 10.6
Malaysia92.6 16.1 14.6 15.0 9.6 24.3 35.5 38.1 28.6 21.0 n.a.
Austria 39.7 11.3 11.0 14.0 10.8 10.6 9.2 14.4 13.0 12.7 9.9
Israel 351.7 51.4 35.1 40.9 43.6 39.6 43.4 42.2 34.0 38.3 31.7
Switzerland 619.4 15.4 17.6 17.5 16.6 17.5 14.7 20.3 19.7 20.1 16.3
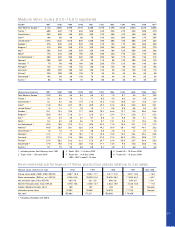
Heavy Volvo trucks (>16 t) registered
Number 1987 1988 1989 1990 1991 1992 1993 1994 1995 1996 1997
Total Western Europe1, 3 22,380 24,740 26,710 23,150 21,760 18,300 14,100 21,300 28,000 29,200 26,200
United States 510,840 17,090 17,340 14,770 12,110 14,640 19,380 22,990 23,410 15,460 17,290
Brazil 42,100 2,370 2,410 2,910 2,210 2,350 4,110 5,870 5,820 3,570 4,510
Great Britain 45,550 6,260 6,440 4,010 2,930 3,210 4,210 5,480 6,140 5,780 4,420
France 43,650 3,940 4,030 4,000 4,050 3,000 2,060 3,490 4,500 4,770 4,130
Germany 1, 3 880 930 1,170 1,460 3,570 2,520 1,390 1,700 2,740 3,270 3,090
Canada5440 1,800 2,140 1,370 880 1,100 1,510 1,630 1,700 1,320 2,470
the Netherlands 31,760 1,740 1,660 1,780 1,740 1,740 940 1,630 1,900 2,210 2,140
Spain 3840 1,480 1,890 1,390 1,420 1,050 610 1,060 1,560 1,540 1,940
Italy 31,170 1,580 1,860 1,840 1,610 1,440 1,020 1,280 2,040 2,170 1,850
Sweden 32,400 2,500 2,880 2,170 1,250 900 670 1,090 1,430 2,070 1,640
Belgium 31,190 1,300 1,590 1,320 1,380 1,070 760 1,130 1,790 1,520 1,550
Norway 31,080 700 440 500 370 370 420 990 1,220 1,200 1,220
Poland 7110 130 110 130 240 160 250 530 910 890 1,140
Turkey 760 110 190 340 300 490 500 670 880 770 1,090
Denmark 4970 890 900 830 740 790 610 1,030 1,440 1,480 1,050
Portugal3880 1,170 1,210 950 920 770 480 480 630 660 830
Finland3840 920 1,110 960 490 300 200 490 870 780 750
Iran — 40 400 2,310 4,480 1,360 720 — — 950 730
Australia 470 760 1,080 1,000 650 470 480 710 720 520 590
Malaysia710 50 120 110 60 160 170 250 450 670 560
Austria 360 510 470 740 500 450 360 640 610 590 530
Israel 3740 660 240 420 980 620 980 1,050 840 840 390
Switzerland 500 520 600 670 400 340 210 350 480 500 380
1 Including former East Germany from 1991.
2 Trucks ≥10 tons payload up to 1987.
From 1988 ≥15 tons GVW.
3 Trucks ≥16 tons GVW.
4 Trucks ≥15 tons GVW.
5 Trucks ≥15 tons GVW (Class 8).
6 Trucks ≥14 tons GVW up to 1990.
From 1991 ≥16 tons GVW.
7 Trucks import ≥16 tons GVW.
Registrations as from 1996.
8 Trucks ≥15 tons GVW 1987–1996.
Trucks ≥16 tons 1997.
9 Trucks import ≥16 tons GVW.
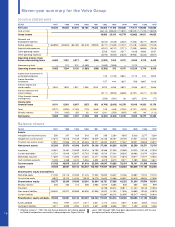
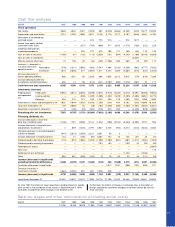
Eleven-year summary