Volvo 1997 Annual Report Download - page 86
Download and view the complete annual report
Please find page 86 of the 1997 Volvo annual report below. You can navigate through the pages in the report by either clicking on the pages listed below, or by using the keyword search tool below to find specific information within the annual report.-
 1
1 -
2
-
3
-
4
-
5
-
6
-
7
-
8
-
9
-
10
-
11
-
12
-
13
-
14
-
15
-
16
-
17
-
18
-
19
-
20
-
21
-
22
-
23
-
24
-
25
-
26
-
27
-
28
-
29
-
30
-
31
-
32
-
33
-
34
-
35
-
36
-
37
-
38
-
39
-
40
-
41
-
42
-
43
-
44
-
45
-
46
-
47
-
48
-
49
-
50
-
51
-
52
-
53
-
54
-
55
-
56
-
57
-
58
-
59
-
60
-
61
-
62
-
63
-
64
-
65
-
66
-
67
-
68
-
69
-
70
-
71
-
72
-
73
-
74
-
75
-
 76
76 -
 77
77 -
 78
78 -
 79
79 -
 80
80 -
 81
81 -
 82
82 -
 83
83 -
 84
84 -
 85
85 -
 86
86 -
 87
87 -
 88
88 -
 89
89 -
 90
90 -
 91
91 -
 92
92 -
 93
93
 |
 |

84
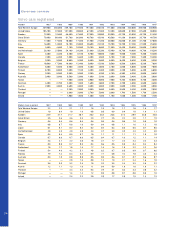
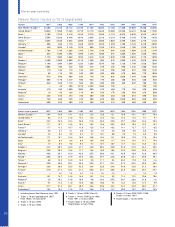
Volvo cars registered
Number 1987 1988 1989 1990 1991 1992 1993 1994 1995 1996 1997
Total Western Europe 259,900 260,000 259,100 227,900 197,300 200,100 171,000 200,500 220,000 205,900 230,900
United States 105,100 97,800 101,900 89,000 67,200 67,900 72,200 80,800 87,000 87,600 90,000
Sweden 72,500 74,600 66,600 47,600 37,900 35,800 33,000 42,700 49,000 43,700 51,400
Great Britain 70,900 80,400 81,700 66,000 46,700 43,100 43,500 41,200 39,600 33,700 40,700
Germany 17,300 17,500 18,000 17,300 21,900 21,200 20,500 26,000 31,400 31,700 37,000
Italy 16,300 14,800 15,100 23,000 20,600 22,100 15,700 19,700 27,200 21,900 25,300
Japan 3,400 4,600 7,100 10,900 10,100 8,600 11,900 15,400 20,500 24,000 19,900
the Netherlands 26,100 21,800 24,100 24,200 21,000 23,200 15,400 16,700 19,000 19,700 19,200
Spain 3,400 4,400 5,200 6,100 8,700 10,800 7,600 9,500 9,200 9,300 10,400
Canada 7,400 6,200 7,000 5,600 4,200 3,500 5,100 7,100 7,800 7,300 10,200
Belgium 9,200 9,000 9,800 9,300 8,400 9,600 6,300 8,400 8,600 9,300 9,200
France 18,800 17,300 16,600 12,400 8,900 12,100 8,500 9,500 6,800 8,200 7,600
Switzerland 5,300 5,500 5,500 4,600 5,400 4,800 4,100 4,800 6,000 6,000 7,000
Finland 8,100 8,000 7,500 7,100 4,200 4,300 3,900 4,200 5,500 6,400 6,800
Norway 9,200 5,000 3,500 3,900 3,200 4,200 4,100 6,300 6,300 5,800 5,600
Australia 3,400 3,900 3,500 2,600 1,900 2,100 2,600 3,000 3,400 3,200 3,900
Taiwan — — 7,500 4,500 2,800 5,000 7,500 9,200 10,000 5,700 3,600
Denmark 4,400 2,700 2,500 1,900 1,600 2,800 2,700 4,700 4,500 3,500 3,400
Austria 2,900 3,000 3,600 3,000 3,300 3,000 2,500 2,800 2,900 3,000 3,000
Thailand — — 2,200 2,800 3,500 3,600 5,400 5,500 5,400 4,900 2,800
Portugal — — 2,600 3,000 2,700 2,600 2,000 1,700 1,500 1,700 2,200
Ireland — — 1,800 1,800 1,300 1,300 1,100 1,600 1,600 1,600 1,700
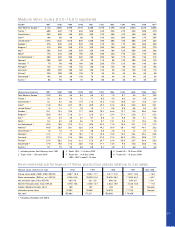
Market share in percent 1987 1988 1989 1990 1991 1992 1993 1994 1995 1996 1997
Total Western Europe 2.2 2.2 2.1 1.7 1.5 1.5 1.5 1.7 1.8 1.6 1.7
United States 1.0 0.9 1.0 1.0 0.8 0.8 0.9 0.9 1.0 1.0 1.1
Sweden 22.9 21.7 21.7 20.7 20.2 23.2 26.6 27.4 28.9 23.8 22.8
Great Britain 3.5 3.6 3.6 3.3 2.9 2.7 2.5 2.2 2.0 1.7 1.9
Germany 0.6 0.6 0.6 0.6 0.6 0.5 0.6 0.8 1.0 0.9 1.0
Italy 0.8 0.7 0.6 1.0 0.9 0.9 0.8 1.1 1.6 1.2 1.0
Japan 0.1 0.1 0.2 0.2 0.2 0.2 0.4 0.5 0.5 0.7 0.6
the Netherlands 4.8 4.5 4.9 4.8 4.3 4.7 3.9 3.9 4.3 4.2 4.0
Spain 0.4 0.4 0.5 0.7 1.0 1.1 1.1 1.1 1.1 1.0 1.0
Canada 0.7 0.6 0.7 0.6 0.5 0.4 0.7 1.0 1.2 1.1 1.4
Belgium 2.3 2.1 2.2 2.0 1.8 2.1 1.7 2.2 2.4 2.4 2.3
France 0.9 0.8 0.7 0.5 0.4 0.6 0.5 0.5 0.4 0.4 0.4
Switzerland 1.8 1.7 1.8 1.4 1.7 1.6 1.6 1.8 2.2 2.2 2.6
Finland 5.4 4.6 4.2 5.1 4.8 6.2 6.7 6.3 6.9 6.7 6.6
Norway 7.9 7.4 6.4 6.3 5.9 7.1 6.8 7.4 7.0 4.6 4.4
Australia 0.9 1.0 0.8 0.8 0.5 0.5 0.6 0.7 0.7 0.6 0.7
Taiwan — — 2.0 1.3 0.8 1.2 1.9 2.1 2.4 1.6 1.0
Denmark 3.6 3.0 3.2 2.4 1.8 3.2 3.3 3.4 3.3 2.5 2.2
Austria 1.2 1.1 1.3 1.0 1.1 0.9 0.9 1.0 1.0 1.0 1.1
Thailand — — 4.4 4.3 5.3 2.9 3.1 3.6 3.3 2.8 2.2
Portugal — — 1.4 1.4 1.2 0.9 0.8 0.7 0.8 0.8 1.0
Ireland — — 2.4 2.2 2.0 2.0 1.7 2.0 1.9 1.4 1.3
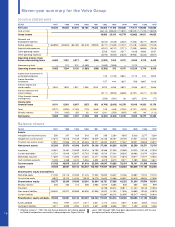
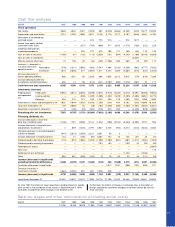
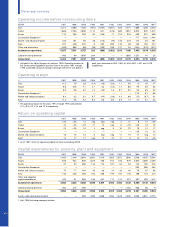
Eleven-year summary