Volvo 1997 Annual Report Download - page 79
Download and view the complete annual report
Please find page 79 of the 1997 Volvo annual report below. You can navigate through the pages in the report by either clicking on the pages listed below, or by using the keyword search tool below to find specific information within the annual report.-
 1
1 -
2
-
3
-
4
-
5
-
6
-
7
-
8
-
9
-
10
-
11
-
12
-
13
-
14
-
15
-
16
-
17
-
18
-
19
-
20
-
21
-
22
-
23
-
24
-
25
-
26
-
27
-
28
-
29
-
30
-
31
-
32
-
33
-
34
-
35
-
36
-
37
-
38
-
39
-
40
-
41
-
42
-
43
-
44
-
45
-
46
-
47
-
48
-
49
-
50
-
51
-
52
-
53
-
54
-
55
-
56
-
57
-
58
-
59
-
60
-
61
-
62
-
63
-
64
-
65
-
66
-
67
-
68
-
 69
69 -
 70
70 -
 71
71 -
 72
72 -
 73
73 -
 74
74 -
 75
75 -
 76
76 -
 77
77 -
 78
78 -
 79
79 -
 80
80 -
 81
81 -
 82
82 -
 83
83 -
 84
84 -
 85
85 -
 86
86 -
 87
87 -
 88
88 -
 89
89 -
90
-
91
-
92
-
93
 |
 |
77
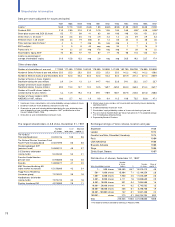
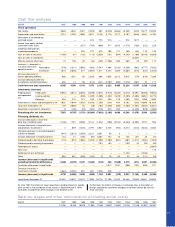
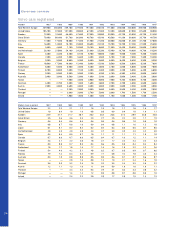
Cash flow analyses
SEK M 1987 1988 1989 1990 1991 1992 1993 1994 1995 1996 1997
Year’s operations
Net income 5,665 4,940 4,787 (1,020) 682 (3,320) (3,466) 13,230 9,262 12,477 10,359
Depreciation and amortization 2,213 2,293 2,685 3,021 3,129 3,119 3,777 5,107 5,656 5,351 6,796
Write-down of shareholdings
and fixed assets — — — 674 725 315 — 574 1,817 — —
Income from equity method
investments after taxes — — (337) (704) (899) 417 2,815 (1,274) (730) (222) 220
Dividends received from
associated companies — — 225 277 675 700 717 160 404 119 145
Gain on sales of securities (1,186) (47) (126) (116) (2,026) (131) (504) (4,243) (1,180) (8,169) (4,068)
Gain on sales of subsidiaries — — — — — — — — (3,032) — —
Minority interests after taxes 74 103 35 (26) (439) (1,286) 356 365 45 (99) 112
Increase (–), decrease (+)
in current short-term Receivables (378) (1,221) (1,892) (966) (1,347) 1,484 (2,732) (3,538) (962) (4,777) (7,452)
operating assets: Inventories 1,674 (2,840) 571 (1,897) 1,611 2,373 2,209 (2,687) (516) (547) (2,575)
Increase (decrease) in
current operating liabilities 968 1.351 58 2,639 608 1,859 6,312 5,915 570 (618) 7,280
Increase (decrease) deferred
tax liabilities and other provisions 352 14 98 (812) (521) (2,207) (989) (1,373) (267) 23 711
Cash flow from year’s operations 9,382 4,593 6,104 1,070 2,198 3,323 8,495 12,236 11,067 3,538 11,528
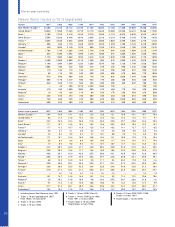
Investments (increase)
Property, plant Fixed assets (3,864) (4,641) (6,504) (4,598) (2,874) (2,915) (3,465) (4,274) (6,491) (8,200) (9,863)
and equipment, Leasing vehicles — — (400) (1,200) (1,000) (1,352) (1,678) (2,495) (2,585) (3,851) (9,773)
etc: Disposals 334 274 747 180 1,243 299 770 1,460 1,351 1,958 1,855
Investments in shares and participations, net 1,852 (1,849) (1,635) (5,456) (7,238) (224) 464 8,182 1,953 14,080 10, 669
Long-term receivables, net 139 (3,008) 36 (28) (102) (1,620) (280) (1,563) (1,953) (2,804) (6,031)
Acquisitions and sales of companies 8 (166) (49) (964) (210) 323 393 — (4,420) (878) (1,303)
Remaining after net investments 7,851 (4,797) (1,701) (10,996) (7,983) (2,166) 4,699 13,546 (1,078) 3,843 (2,918)
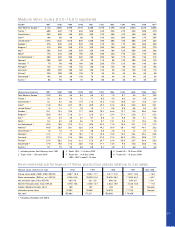
Financing, dividends, etc
Increase (decrease) in short-term
bank loans and other loans (1,148) 1,781 8,288 5,124 (1,542) (298) (5,104) (6,233) (3,993) 5,151 995
Increase (decrease) in long-term loans
and provisions for pensions 2 839 (1,445) 2,797 2,847 3,745 (753) (2,011) 6,166 (1,844) 3,404
(Increase) decrease in restricted deposits
in Bank of Sweden (541) (2,313) (1,259) 3,221 2,031 39 2 — — — —
Increase (decrease) in minority interests 134 41 (105) (87) 5,282 122 15 145 (37) 45 (21)
Dividends paid to AB Volvo shareholders (718) (815) (1,086) (1,203) (1,203) (1,203) (601) (601) (1,512) (1,854) (1,993)
Dividends paid to minority shareholders — — — — (157) (81) — (132) (3) (33) (83)
Redemption of shares — — — — — — — — — — (5,807)
New issue — — — — — — — — — — 116
Settlement of loan to Renault — — — — — — — (1,422) — (1,536) —
Other 804 691 (355) (342) (7) 78 93 23 46 (121) (22)
Increase (decrease) in liquid funds
excluding translation differences 6,384 (4,573) 2,337 (1,486) (732) 236 (1,649) 3,315 (411) 3,651 (6,329)
Translation differences in liquid funds — — — — — 1,817 1,331 (308) (732) (296) 271
Decrease (increase) in
investments in bonds (1,664) (2,292) 501 601 1,926 928 — — — — —
Increase (decrease) in liquid funds 4,720 (6,865) 2,838 (885) 1,194 2,981 (318) 3,007 (1,143) 3,355 (6,058)
Liquid funds, December 31 22,497 15,632 18,470 17,585 18,779 21,760 21,442 24,449 23,306 26,661 20,603
Salaries, wages and other remuneration (including social costs)
SEK M 1987 1988 1989 1990 1991 1992 1993 1994 1995 1996 1997
14,106 15,434 16,875 17,865 17,654 16,857 19,489 24,156 27,248 25,997 26,951
As from 1992 the effects of major acquisitions and divestments of subsidi-
aries as well as the distribution of the shares in Swedish Match in 1996
have been excluded from other changes in the balance sheet.
Furthermore, the effects of changes in exchange rates at translation of
foreign subsidiaries have been excluded, since these effects do not influ-
ence cash flow.