U-Haul 2006 Annual Report Download - page 99
Download and view the complete annual report
Please find page 99 of the 2006 U-Haul annual report below. You can navigate through the pages in the report by either clicking on the pages listed below, or by using the keyword search tool below to find specific information within the annual report.-
 1
1 -
2
-
3
-
4
-
5
-
6
-
7
-
8
-
9
-
10
-
11
-
12
-
13
-
14
-
15
-
16
-
17
-
18
-
19
-
20
-
21
-
22
-
23
-
24
-
25
-
26
-
27
-
28
-
29
-
30
-
31
-
32
-
33
-
34
-
35
-
36
-
37
-
38
-
39
-
40
-
41
-
42
-
43
-
44
-
45
-
46
-
47
-
48
-
49
-
50
-
51
-
52
-
53
-
54
-
55
-
56
-
57
-
58
-
59
-
60
-
61
-
62
-
63
-
64
-
65
-
66
-
67
-
68
-
69
-
70
-
71
-
72
-
73
-
74
-
75
-
76
-
77
-
78
-
79
-
80
-
81
-
82
-
83
-
84
-
85
-
86
-
87
-
88
-
 89
89 -
 90
90 -
 91
91 -
 92
92 -
 93
93 -
 94
94 -
 95
95 -
 96
96 -
 97
97 -
 98
98 -
 99
99 -
 100
100 -
 101
101 -
 102
102 -
 103
103 -
 104
104 -
 105
105 -
 106
106 -
 107
107 -
 108
108 -
 109
109 -
110
-
111
-
112
-
113
-
114
-
115
-
116
-
117
-
118
-
119
-
120
-
121
-
122
-
123
-
124
-
125
-
126
-
127
-
128
-
129
-
130
-
131
-
132
-
133
-
134
-
135
-
136
-
137
-
138
-
139
-
140
-
141
-
142
-
143
-
144
-
145
-
146
 |
 |

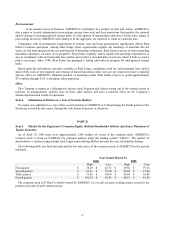
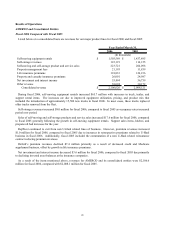
Item 6.
Selected Financial Data
The following selected financial data should be read in conjunction with Management’ s Discussion and Analysis
of Financial Condition and Results of Operations (MD&A), and the consolidated financial statements and related
notes in the Annual Report on Form 10-K.
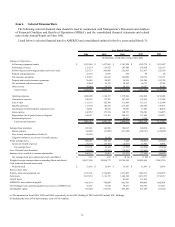
Listed below is selected financial data for AMERCO and consolidated entities for the five years ended March 31:
2006 2005 2004 2003 2002
Summary of Operations:
Self-moving equipment rentals $ 1,503,569 $ 1,437,895 $ 1,381,208 $ 1,293,732 $ 1,253,887
Self-storage revenues 122,119 114,155 247,640 238,938 223,135
Self-moving and self-storage products and service sales 223,721 206,098 232,965 223,677 225,510
Property management fees 21,195 11,839 259 89 88
Life insurance premiums 118,833 126,236 145,082 158,719 157,371
Property and casualty insurance premiums 26,001 24,987 92,036 149,206 253,799
Net investment and interest income 53,094 56,739 38,281 40,731 47,343
Other revenue 38,094 30,172 38,523 36,252 38,283
Total revenues 2,106,626 2,008,121 2,175,994 2,141,344 2,199,416
Operating expenses 1,080,990 1,122,197 1,179,996 1,182,222 1,212,403
Commission expenses 180,101 172,307 147,010 138,652 137,806
Cost of sales 113,135 105,309 111,906 115,115 122,694
Benefits and losses 117,160 140,343 217,447 248,349 376,673
Amortization of deferred policy acquisition costs 24,261 28,512 39,083 37,681 40,674
Lease expense 142,781 151,354 160,727 166,101 164,075
Depreciation, net of (gains) losses on disposal 142,817 121,103 148,813 137,446 102,957
Restructuring expense - - 44,097 6,568 -
Total costs and expenses 1,801,245 1,841,125 2,049,079 2,032,134 2,157,282
Earnings from operations 305,381 166,996 126,915 109,210 42,134
Interest expense (69,481) (73,205) (121,690) (148,131) (109,465)
Fees on early extinguishment of debt (b) (35,627) - - - -
Litigation settlement, net of costs, fees and expenses - 51,341 - - -
Pretax earnings (loss) 200,273 145,132 5,225 (38,921) (67,331)
Income tax benefit (expense) (79,119) (55,708) (8,077) 13,935 19,891
Net earnings (loss) 121,154 89,424 (2,852) (24,986) (47,440)
Less: Preferred stock dividends (12,963) (12,963) (12,963) (12,963) (12,963)
Earnings (loss) available to common shareholders $ 108,191 $ 76,461 $ (15,815) $ (37,949) $ (60,403)
Net earnings (loss) per common share basic and diluted $ 5.19 $ 3.68 $ (0.76)$ $ (1.82) $ (2.87)
Weighted average common shares outstanding: Basic and diluted 20,857,108 20,804,773 20,749,998 20,824,618 21,063,720
Cash dividends declared and accrued
Preferred stock $ 12,963 $ 12,963 $ 12,963 $ 12,963 $ 12,963
Balance Sheet Data:
Property, plant and equipment, net 1,535,165 1,354,468 1,451,805 1,946,317 1,936,076
Total assets 3,367,218 3,116,173 3,394,748 3,832,372 3,732,317
Capital leases - - 99,607 137,031 -
AMERCO's notes and loans payable 965,634 780,008 862,703 940,063 1,045,801
SAC Holdings' notes and loans payable non-recourse to AMERCO (a) 76,232 77,474 78,637 466,781 561,887
Stockholders' equity 695,604 572,839 503,846 327,448 381,524
(a) The amounts for fiscal 2006, 2005 and 2004, respectively are for SAC Holding II; 2003 and 2002 include SAC Holdings.
(b) Includes the write off of debt issuance costs of $14.4 million.
Year Ended March 31,
(In thousands, except share and per share data)
16