U-Haul 2006 Annual Report Download - page 66
Download and view the complete annual report
Please find page 66 of the 2006 U-Haul annual report below. You can navigate through the pages in the report by either clicking on the pages listed below, or by using the keyword search tool below to find specific information within the annual report.-
 1
1 -
2
-
3
-
4
-
5
-
6
-
7
-
8
-
9
-
10
-
11
-
12
-
13
-
14
-
15
-
16
-
17
-
18
-
19
-
20
-
21
-
22
-
23
-
24
-
25
-
26
-
27
-
28
-
29
-
30
-
31
-
32
-
33
-
34
-
35
-
36
-
37
-
38
-
39
-
40
-
41
-
42
-
43
-
44
-
45
-
46
-
47
-
48
-
49
-
50
-
51
-
52
-
53
-
54
-
55
-
 56
56 -
 57
57 -
 58
58 -
 59
59 -
 60
60 -
 61
61 -
 62
62 -
 63
63 -
 64
64 -
 65
65 -
 66
66 -
 67
67 -
 68
68 -
 69
69 -
 70
70 -
 71
71 -
 72
72 -
 73
73 -
 74
74 -
 75
75 -
 76
76 -
77
-
78
-
79
-
80
-
81
-
82
-
83
-
84
-
85
-
86
-
87
-
88
-
89
-
90
-
91
-
92
-
93
-
94
-
95
-
96
-
97
-
98
-
99
-
100
-
101
-
102
-
103
-
104
-
105
-
106
-
107
-
108
-
109
-
110
-
111
-
112
-
113
-
114
-
115
-
116
-
117
-
118
-
119
-
120
-
121
-
122
-
123
-
124
-
125
-
126
-
127
-
128
-
129
-
130
-
131
-
132
-
133
-
134
-
135
-
136
-
137
-
138
-
139
-
140
-
141
-
142
-
143
-
144
-
145
-
146
 |
 |

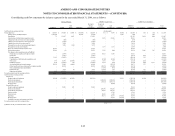
CONDENSED FINANCIAL INFORMATION OF AMERCO
STATEMENTS OF OPERATIONS
2006 2005 2004
Revenues:
Net interest income from subsidiaries $ 5,567 $ 8,348 $ 2,416
Expenses:
Operating expenses 12,722 18,065 37,080
Restructuring expenses - - 44,097
Other expenses 160 121 825
Total expenses 12,882 18,186 82,002
Equity in earnings of subsidiaries and SAC Holdings (a) 163,388 106,441 86,817
Interest expense (24,636) (70,235) (56,968)
Fees on early extinguishment of debt (35,627) - -
Litigation settlement income, net of costs - 51,341 -
Pretax earnings (loss) 95,810 77,709 (49,737)
Income tax benefit 24,996 11,367 45,690
Net earnings (loss) 120,806 89,076 (4,047)
Less: preferred stock dividends (12,963) (12,963) (12,963)
Earnings (loss) available to common shareholders $ 107,843 $ 76,113 $ (17,010)
Basic and diluted earnings (loss) per common share $ 5.17 $3.66 $ (0.82)
Weighted average common shares outstanding: Basic and diluted 20,857,108 20,804,773 20,749,998
(a) Fiscal 2006 and 2005 contain only SAC Holding Corporation II, fiscal 2004 includes SAC Holding Corporation and its subsidiaries
(In thousands, except share and per share data)
Years Ended March 31,
The accompanying notes are an integral part of these consolidated financial statements.
F-59