U-Haul 2006 Annual Report Download - page 111
Download and view the complete annual report
Please find page 111 of the 2006 U-Haul annual report below. You can navigate through the pages in the report by either clicking on the pages listed below, or by using the keyword search tool below to find specific information within the annual report.-
 1
1 -
2
-
3
-
4
-
5
-
6
-
7
-
8
-
9
-
10
-
11
-
12
-
13
-
14
-
15
-
16
-
17
-
18
-
19
-
20
-
21
-
22
-
23
-
24
-
25
-
26
-
27
-
28
-
29
-
30
-
31
-
32
-
33
-
34
-
35
-
36
-
37
-
38
-
39
-
40
-
41
-
42
-
43
-
44
-
45
-
46
-
47
-
48
-
49
-
50
-
51
-
52
-
53
-
54
-
55
-
56
-
57
-
58
-
59
-
60
-
61
-
62
-
63
-
64
-
65
-
66
-
67
-
68
-
69
-
70
-
71
-
72
-
73
-
74
-
75
-
76
-
77
-
78
-
79
-
80
-
81
-
82
-
83
-
84
-
85
-
86
-
87
-
88
-
89
-
90
-
91
-
92
-
93
-
94
-
95
-
96
-
97
-
98
-
99
-
100
-
 101
101 -
 102
102 -
 103
103 -
 104
104 -
 105
105 -
 106
106 -
 107
107 -
 108
108 -
 109
109 -
 110
110 -
 111
111 -
 112
112 -
 113
113 -
 114
114 -
 115
115 -
 116
116 -
 117
117 -
 118
118 -
 119
119 -
 120
120 -
 121
121 -
122
-
123
-
124
-
125
-
126
-
127
-
128
-
129
-
130
-
131
-
132
-
133
-
134
-
135
-
136
-
137
-
138
-
139
-
140
-
141
-
142
-
143
-
144
-
145
-
146
 |
 |

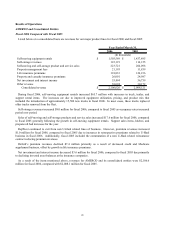
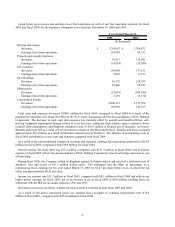
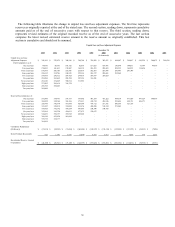
Listed below are revenues and earnings (loss) from operations at each of our four operating segments for fiscal
2005 and fiscal 2004; for the insurance companies years ended are December 31, 2004 and 2003:
2005 2004
Moving and storage
Revenues $ 1,791,667 $ 1,768,872
Earnings (loss) from operations 165,985 93,593
Property and casualty insurance
Revenues 41,417 114,941
Earnings (loss) from operations (14,814) (35,950)
Life insurance
Revenues 159,484 177,812
Earnings (loss) from operations 2,065 11,253
SAC Holdings
Revenues 43,172 218,955
Earnings (loss) from operations 10,466 64,693
Eliminations
Revenues (27,619) (104,586)
Earnings (loss) from operations 3,294 (6,674)
Consolidated Results
Revenues 2,008,121 2,175,994
Earnings (loss) from operations 166,996 126,915
Year Ended March 31,
(In thousands)
Total costs and expenses decreased $208.0 million for fiscal 2005, compared to fiscal 2004 as a result of the
productivity initiatives of U-Haul, the effect of the W.P. Carey Transaction and the deconsolidation of SAC Holding
Corporation. The decrease in total costs and expenses was partially offset by payroll and benefit inflation, self-
moving equipment impairment charges related to lease buy-outs, additional depreciation expense related to lower
residual value assumptions, and litigation settlement costs of $10.6 million at Oxford, net of insurance recoveries.
Benefits and losses fell as a result of lower premium revenues at RepWest and Oxford. Benefits and losses included
approximately $8.5 million as a result of hurricane related losses at RepWest. The absence of restructuring costs in
fiscal 2005 contributed to lower costs and expenses compared with fiscal 2004.
As a result of the aforementioned changes in revenues and expenses, earnings from operations improved to $167.0
million for fiscal 2005, compared with $126.9 million for fiscal 2004.
Interest expense for fiscal 2005 was $73.2 million, compared with $121.7 million in fiscal 2004. Lower interest
expense in fiscal 2005 reflects the deconsolidation of SAC Holding Corporation, lower borrowings and a lower cost
of borrowing.
During fiscal 2005, the Company settled its litigation against its former auditor and received a settlement (net of
attorneys’ fees and costs) of $51.3 million before taxes. The settlement had the effect of increasing, on a
nonrecurring basis, earnings for the year ended March 31, 2005 by $2.47 per share before taxes, in which the tax
effect was approximately $0.91 per share.
Income tax expense was $55.7 million in fiscal 2005, compared with $8.1 million in fiscal 2004 and reflects our
higher pretax earnings for fiscal 2005, net of an increase in tax in fiscal 2004 of $4.8 million resulting from our
settlement with the IRS for tax audits related to 1996 and 1997.
Dividends accrued on our Series A preferred stock were $13.0 million in both fiscal 2005 and 2004.
As a result of the above mentioned items, net earnings (loss) available to common shareholders were $76.5
million in fiscal 2005, compared with ($15.8) million in fiscal 2004.
28