U-Haul 2006 Annual Report Download - page 47
Download and view the complete annual report
Please find page 47 of the 2006 U-Haul annual report below. You can navigate through the pages in the report by either clicking on the pages listed below, or by using the keyword search tool below to find specific information within the annual report.-
 1
1 -
2
-
3
-
4
-
5
-
6
-
7
-
8
-
9
-
10
-
11
-
12
-
13
-
14
-
15
-
16
-
17
-
18
-
19
-
20
-
21
-
22
-
23
-
24
-
25
-
26
-
27
-
28
-
29
-
30
-
31
-
32
-
33
-
34
-
35
-
36
-
 37
37 -
 38
38 -
 39
39 -
 40
40 -
 41
41 -
 42
42 -
 43
43 -
 44
44 -
 45
45 -
 46
46 -
 47
47 -
 48
48 -
 49
49 -
 50
50 -
 51
51 -
 52
52 -
 53
53 -
 54
54 -
 55
55 -
 56
56 -
 57
57 -
58
-
59
-
60
-
61
-
62
-
63
-
64
-
65
-
66
-
67
-
68
-
69
-
70
-
71
-
72
-
73
-
74
-
75
-
76
-
77
-
78
-
79
-
80
-
81
-
82
-
83
-
84
-
85
-
86
-
87
-
88
-
89
-
90
-
91
-
92
-
93
-
94
-
95
-
96
-
97
-
98
-
99
-
100
-
101
-
102
-
103
-
104
-
105
-
106
-
107
-
108
-
109
-
110
-
111
-
112
-
113
-
114
-
115
-
116
-
117
-
118
-
119
-
120
-
121
-
122
-
123
-
124
-
125
-
126
-
127
-
128
-
129
-
130
-
131
-
132
-
133
-
134
-
135
-
136
-
137
-
138
-
139
-
140
-
141
-
142
-
143
-
144
-
145
-
146
 |
 |

AMERCO AND CONSOLIDATED ENTITIES
NOTES TO CONSOLIDATED FINANCIAL STATEMENTS -- (CONTINUED)
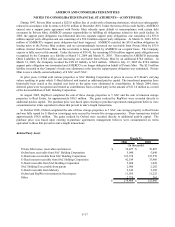
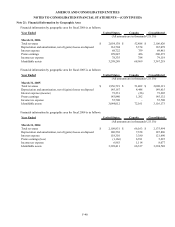
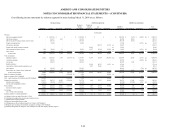
Note 21: Financial Information by Geographic Area
Financial information by geographic area for fiscal 2006 is as follows:
Year Ended United States Canada Consolidated
March 31, 2006
Total revenues $ 2,054,138 $ 52,488 $ 2,106,626
Depreciation and amortization, net of (gains) losses on disposal 161,704 5,374 167,078
Interest expense 68,722 759 69,481
Pretax earnings 199,847 426 200,273
Income tax expense 78,335 784 79,119
Identifiable assets 3,298,249 68,969 3,367,218
(All amounts are in thousands U.S. $'s)
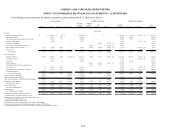
Financial information by geographic area for fiscal 2005 is as follows:
Year Ended United States Canada Consolidated
March 31, 2005
Total revenues $ 1,956,719 $ 51,402 $ 2,008,121
Depreciation and amortization, net of (gains) losses on disposal 145,167 4,448 149,615
Interest expense (income) 73,231 (26) 73,205
Pretax earnings 143,840 1,292 145,132
Income tax expense 55,708 - 55,708
Identifiable assets 3,044,012 72,161 3,116,173
(All amounts are in thousands U.S. $'s)
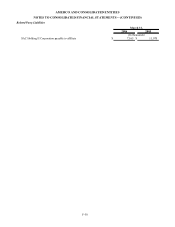
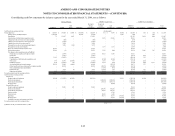
Financial information by geographic area for fiscal 2004 is as follows:
Year Ended United States Canada Consolidated
March 31, 2004
Total revenues $ 2,109,831 $ 66,163 $ 2,175,994
Depreciation and amortization, net of (gains) losses on disposal 180,538 7,358 187,896
Interest expense 118,310 3,380 121,690
Pretax earnings (loss) (1,166) 6,391 5,225
Income tax expense 6,963 1,114 8,077
Identifiable assets 3,328,411 66,337 3,394,748
(All amounts are in thousands U.S. $'s)
F-40