U-Haul 2006 Annual Report Download - page 120
Download and view the complete annual report
Please find page 120 of the 2006 U-Haul annual report below. You can navigate through the pages in the report by either clicking on the pages listed below, or by using the keyword search tool below to find specific information within the annual report.-
 1
1 -
2
-
3
-
4
-
5
-
6
-
7
-
8
-
9
-
10
-
11
-
12
-
13
-
14
-
15
-
16
-
17
-
18
-
19
-
20
-
21
-
22
-
23
-
24
-
25
-
26
-
27
-
28
-
29
-
30
-
31
-
32
-
33
-
34
-
35
-
36
-
37
-
38
-
39
-
40
-
41
-
42
-
43
-
44
-
45
-
46
-
47
-
48
-
49
-
50
-
51
-
52
-
53
-
54
-
55
-
56
-
57
-
58
-
59
-
60
-
61
-
62
-
63
-
64
-
65
-
66
-
67
-
68
-
69
-
70
-
71
-
72
-
73
-
74
-
75
-
76
-
77
-
78
-
79
-
80
-
81
-
82
-
83
-
84
-
85
-
86
-
87
-
88
-
89
-
90
-
91
-
92
-
93
-
94
-
95
-
96
-
97
-
98
-
99
-
100
-
101
-
102
-
103
-
104
-
105
-
106
-
107
-
108
-
109
-
 110
110 -
 111
111 -
 112
112 -
 113
113 -
 114
114 -
 115
115 -
 116
116 -
 117
117 -
 118
118 -
 119
119 -
 120
120 -
 121
121 -
 122
122 -
 123
123 -
 124
124 -
 125
125 -
 126
126 -
 127
127 -
 128
128 -
 129
129 -
 130
130 -
131
-
132
-
133
-
134
-
135
-
136
-
137
-
138
-
139
-
140
-
141
-
142
-
143
-
144
-
145
-
146
 |
 |

Amortization of deferred acquisition costs (DAC) and the value of business acquired (VOBA) was $23.8 million
and $25.0 million for 2004 and 2003, respectively. Annuity amortization increased $0.8 million from 2003 primarily
due to increased surrender activity. Other segments, primarily credit, had decreases of $2.0 million from 2003 due to
decreased new business volume.
Operating expenses were $42.2 million and $38.1 million for 2004 and 2003, respectively. The $10.6 million
accrual related to the Kocher settlement, net of insurance recoveries, accounted for the majority of the variance.
Non-deferrable commissions have decreased $5.5 million from 2003 primarily due to decreased sales of Medicare
supplement and life products.
Earnings from operations were $2.1 million and $11.3 million for 2004 and 2003, respectively. The decrease in
2004 from 2003 is due primarily to the $10.6 million accrual for the Kocher settlement offset by improved
investment income, and positive loss experience in the Medicare supplement and credit insurance segments.
SAC Holding II
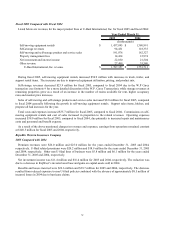
Fiscal 2006 Compared with Fiscal 2005
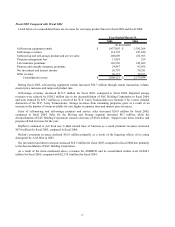
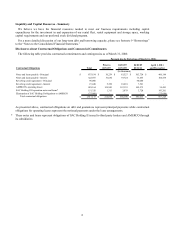
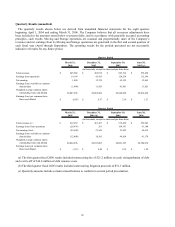
Listed below are revenues for the major product lines at SAC Holding II for fiscal 2006 and fiscal 2005:
2006 2005
Self-moving equipment rentals $ 9,498 $ 9,008
Self-storage revenues 18,869 17,953
Self-moving and self-storage product and service sales 16,602 15,020
Other revenue 1,270 1,191
Segment revenue $ 46,239 $ 43,172
(In thousands)
Year Ended March 31,
Total revenues were $46.2 million in fiscal 2006, compared with $43.2 million in fiscal 2005. The increase was
driven by self-moving and self-storage product and service sales. This increase grew in conjunction with increases
in self-storage revenues due to improved occupancy and pricing.
Total costs and expenses were $32.6 million in fiscal 2006, compared with $32.7 million in fiscal 2005.
Earnings from operations were $13.6 million in fiscal 2006, compared with $10.5 million in fiscal 2005.
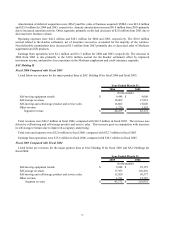
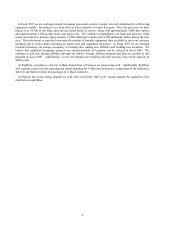
Fiscal 2005 Compared with Fiscal 2004
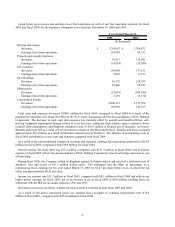
Listed below are revenues for the major product lines at SAC Holding II for fiscal 2005 and SAC Holdings for
fiscal 2004:
2005 2004
Self-moving equipment rentals $ 9,008 $ 29,155
Self-storage revenues 17,953 126,436
Self-moving and self-storage product and service sales 15,020 50,577
Other revenue 1,191 12,787
Segment revenue $ 43,172 $ 218,955
Year Ended March 31,
(In thousands)
37