U-Haul 2006 Annual Report Download - page 113
Download and view the complete annual report
Please find page 113 of the 2006 U-Haul annual report below. You can navigate through the pages in the report by either clicking on the pages listed below, or by using the keyword search tool below to find specific information within the annual report.-
 1
1 -
2
-
3
-
4
-
5
-
6
-
7
-
8
-
9
-
10
-
11
-
12
-
13
-
14
-
15
-
16
-
17
-
18
-
19
-
20
-
21
-
22
-
23
-
24
-
25
-
26
-
27
-
28
-
29
-
30
-
31
-
32
-
33
-
34
-
35
-
36
-
37
-
38
-
39
-
40
-
41
-
42
-
43
-
44
-
45
-
46
-
47
-
48
-
49
-
50
-
51
-
52
-
53
-
54
-
55
-
56
-
57
-
58
-
59
-
60
-
61
-
62
-
63
-
64
-
65
-
66
-
67
-
68
-
69
-
70
-
71
-
72
-
73
-
74
-
75
-
76
-
77
-
78
-
79
-
80
-
81
-
82
-
83
-
84
-
85
-
86
-
87
-
88
-
89
-
90
-
91
-
92
-
93
-
94
-
95
-
96
-
97
-
98
-
99
-
100
-
101
-
102
-
 103
103 -
 104
104 -
 105
105 -
 106
106 -
 107
107 -
 108
108 -
 109
109 -
 110
110 -
 111
111 -
 112
112 -
 113
113 -
 114
114 -
 115
115 -
 116
116 -
 117
117 -
 118
118 -
 119
119 -
 120
120 -
 121
121 -
 122
122 -
 123
123 -
124
-
125
-
126
-
127
-
128
-
129
-
130
-
131
-
132
-
133
-
134
-
135
-
136
-
137
-
138
-
139
-
140
-
141
-
142
-
143
-
144
-
145
-
146
 |
 |

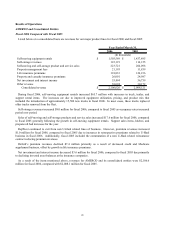
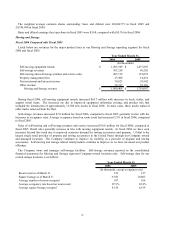
Total costs and expenses increased $2.7 million for fiscal 2006, compared to fiscal 2005. Commissions on self-
moving equipment rentals and cost of sales increased in proportion to the related revenues. Operating expenses
decreased $26.1 million for fiscal 2006, compared to fiscal 2005. Increases in operating costs associated with the
improved business volume were more than offset by reductions in repair and maintenance expenses related to
rotating the fleet. Trucks with higher maintenance costs are being replaced by new trucks with lower initial
maintenance costs. Overall total cost and expense increases were less than revenue increases for fiscal 2006.
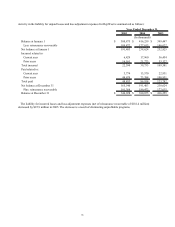
During fiscal 2006, the Company received insurance proceeds of $4.8 million, of this amount $4.5 million was
applied to the losses incurred on trucks and trailers and $0.3 million was applied to the losses sustained at operating
facilities. The net book value of the trucks and trailers lost during the 2005 hurricanes approximates $1.1 million.
Additional insurance recoveries are expected as facilities are restored and claims are filed.
As a result of the above mentioned changes in revenues and expenses, earnings from operations increased to
$292.8 million in fiscal 2006, compared with $166.0 million for fiscal 2005.
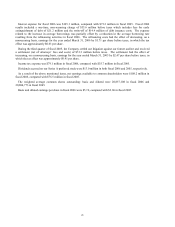
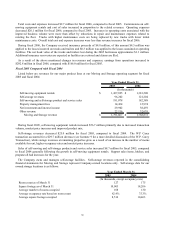
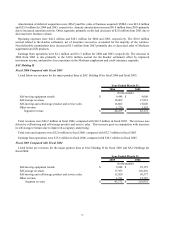
Fiscal 2005 Compared with Fiscal 2004
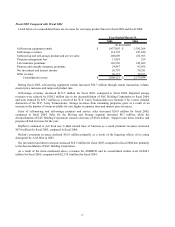
Listed below are revenues for our major product lines at our Moving and Storage operating segment for fiscal
2005 and fiscal 2004:
2005 2004
Self-moving equipment rentals $ 1,437,895 $ 1,381,208
Self-storage revenues 96,202 121,204
Self-moving and self-storage product and service sales 191,078 182,388
Property management fees 14,434 12,974
Net investment and interest income 29,902 38,459
Other revenue 22,156 32,639
Moving and Storage revenue $ 1,791,667 $ 1,768,872
Year Ended March 31,
(In thousands)
During fiscal 2005, self-moving equipment rentals increased $56.7 million primarily due to increased transaction
volume, modest price increases and improved product mix.
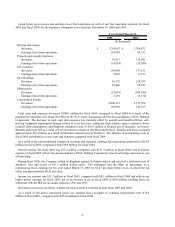
Self-storage revenues decreased $25.0 million for fiscal 2005, compared to fiscal 2004. The W.P Carey
transaction accounted for a $29.7 million decrease (see footnote 9 for a more detailed discussion of the W.P. Carey
Transaction), while storage revenues at remaining properties grew as a result of an increase in the number of rooms
available for rent, higher occupancy rates and modest price increases.
Sales of self-moving and self-storage products and service sales increased $8.7 million for fiscal 2005, compared
to fiscal 2004 generally following the growth in self-moving equipment rentals. Support sales items, hitches, and
propane all had increases for the year.
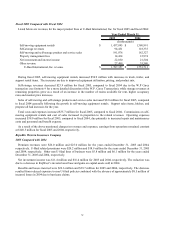
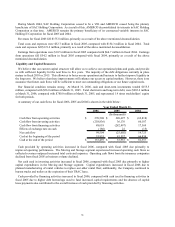
The Company owns and manages self-storage facilities. Self-storage revenues reported in the consolidating
financial statements for Moving and Storage represent Company-owned locations only. Self-storage data for our
owned storage locations is as follows:
2005 2004
Room count as of March 31 127 175
Square footage as of March 31 10,003 14,206
Average number of rooms occupied 108 130
Average occupancy rate based on room count 82.4% 75.3%
Average square footage occupied 8,514 10,463
Year Ended March 31,
(In thousands, except occupancy rate)
30