U-Haul 2006 Annual Report Download - page 63
Download and view the complete annual report
Please find page 63 of the 2006 U-Haul annual report below. You can navigate through the pages in the report by either clicking on the pages listed below, or by using the keyword search tool below to find specific information within the annual report.-
 1
1 -
2
-
3
-
4
-
5
-
6
-
7
-
8
-
9
-
10
-
11
-
12
-
13
-
14
-
15
-
16
-
17
-
18
-
19
-
20
-
21
-
22
-
23
-
24
-
25
-
26
-
27
-
28
-
29
-
30
-
31
-
32
-
33
-
34
-
35
-
36
-
37
-
38
-
39
-
40
-
41
-
42
-
43
-
44
-
45
-
46
-
47
-
48
-
49
-
50
-
51
-
52
-
 53
53 -
 54
54 -
 55
55 -
 56
56 -
 57
57 -
 58
58 -
 59
59 -
 60
60 -
 61
61 -
 62
62 -
 63
63 -
 64
64 -
 65
65 -
 66
66 -
 67
67 -
 68
68 -
 69
69 -
 70
70 -
 71
71 -
 72
72 -
 73
73 -
74
-
75
-
76
-
77
-
78
-
79
-
80
-
81
-
82
-
83
-
84
-
85
-
86
-
87
-
88
-
89
-
90
-
91
-
92
-
93
-
94
-
95
-
96
-
97
-
98
-
99
-
100
-
101
-
102
-
103
-
104
-
105
-
106
-
107
-
108
-
109
-
110
-
111
-
112
-
113
-
114
-
115
-
116
-
117
-
118
-
119
-
120
-
121
-
122
-
123
-
124
-
125
-
126
-
127
-
128
-
129
-
130
-
131
-
132
-
133
-
134
-
135
-
136
-
137
-
138
-
139
-
140
-
141
-
142
-
143
-
144
-
145
-
146
 |
 |

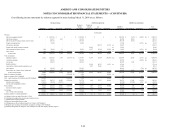
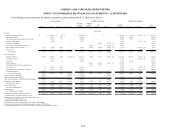
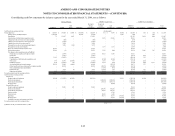
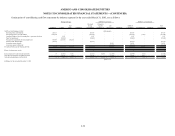
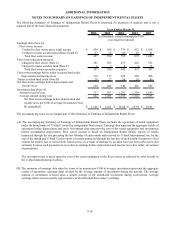
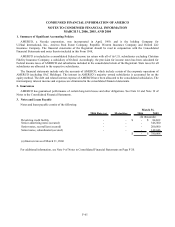
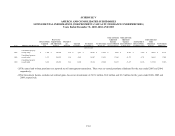
ADDITIONAL INFORMATION
NOTES TO SUMMARY OF EARNINGS OF INDEPENDENT RENTAL FLEETS
The following Summary of Earnings of Independent Rental Fleets is presented for purposes of analysis and is not a
required part of the basic financial statements.
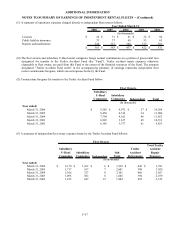
2006 2005 2004 2003 2002
Earnings data (Note A):
Fleet owner income:
Credited to fleet owner gross rental income $ 430 $ 560 $ 739 $ 823 $ 1,028
Credited to trailer accident fund (Notes D and E) 27 34 46 49 61
Total fleet owner income 457 594 785 872 1,089
Fleet owner operation expenses:
Charged to fleet owner (Note C) 301 383 437 422 532
Charged to trailer accident fund (Note F) 6 7 8 9 15
Total fleet owner operation expenses 307 390 445 431 547
Fleet owner earnings before trailer accident fund credit,
depreciation and income taxes 130 177 304 402 496
Trailer accident fund credit (Note D) 20 27 36 39 46
N
et
fl
eet owner earn
i
ngs
b
e
f
ore
d
eprec
i
at
i
on an
d
income taxes 150 204 340 441 542
Investment data (Note A):
Amount at end of year 717 967 1,202 1,389 1,663
Average amount during year 842 1,085 1,296 1,526 1,855
Net fleet owner earnings before depreciation and
income taxes per $100 of average investment (Note
B) (unaudited) $12.48 $ 14.01 $ 18.84 $ 19.95 $ 20.06
Year Ended March 31,
(In thousands, except earnings per $100
of average Investment)
The accompanying notes are an integral part of this Summary of Earnings of Independent Rental Fleets.
(A) The accompanying Summary of Earnings of Independent Rental Fleets includes the operations of rental equipment
under the brand name of “U-Haul” owned by independent fleet owners. Earnings data represent the aggregate results of
operations before depreciation and taxes. Investment data represent the cost of the rental equipment and investments
before accumulated depreciation. Fleet owner income is based on Independent Rental Dealer reports of rentals
transacted through the day preceding the last Monday of each month and received by U-Haul International, Inc. by the
end of the month and U-Haul Center reports of rentals transacted through the last day of each month. Payments to fleet
owners for trailers lost or retired from rental service as a result of damage by accident have not been reflected in this
summary because such payments do not relate to earnings before depreciation and income taxes but, rather, investment
(depreciation).
The investment data is based upon the cost of the rental equipment to the fleet owners as reflected by sales records of
the U-Haul manufacturing facilities.
(B) The summary of earnings data stated in terms of an amount per $100 of average investment represents the aggregate
results of operations (earnings data) divided by the average amount of investment during the periods. The average
amount of investment is based upon a simple average of the month-end investment during each period. Average
earnings data is not necessarily representative of an individual fleet owner’ s earnings.
F-56