U-Haul 2006 Annual Report Download - page 53
Download and view the complete annual report
Please find page 53 of the 2006 U-Haul annual report below. You can navigate through the pages in the report by either clicking on the pages listed below, or by using the keyword search tool below to find specific information within the annual report.-
 1
1 -
2
-
3
-
4
-
5
-
6
-
7
-
8
-
9
-
10
-
11
-
12
-
13
-
14
-
15
-
16
-
17
-
18
-
19
-
20
-
21
-
22
-
23
-
24
-
25
-
26
-
27
-
28
-
29
-
30
-
31
-
32
-
33
-
34
-
35
-
36
-
37
-
38
-
39
-
40
-
41
-
42
-
 43
43 -
 44
44 -
 45
45 -
 46
46 -
 47
47 -
 48
48 -
 49
49 -
 50
50 -
 51
51 -
 52
52 -
 53
53 -
 54
54 -
 55
55 -
 56
56 -
 57
57 -
 58
58 -
 59
59 -
 60
60 -
 61
61 -
 62
62 -
 63
63 -
64
-
65
-
66
-
67
-
68
-
69
-
70
-
71
-
72
-
73
-
74
-
75
-
76
-
77
-
78
-
79
-
80
-
81
-
82
-
83
-
84
-
85
-
86
-
87
-
88
-
89
-
90
-
91
-
92
-
93
-
94
-
95
-
96
-
97
-
98
-
99
-
100
-
101
-
102
-
103
-
104
-
105
-
106
-
107
-
108
-
109
-
110
-
111
-
112
-
113
-
114
-
115
-
116
-
117
-
118
-
119
-
120
-
121
-
122
-
123
-
124
-
125
-
126
-
127
-
128
-
129
-
130
-
131
-
132
-
133
-
134
-
135
-
136
-
137
-
138
-
139
-
140
-
141
-
142
-
143
-
144
-
145
-
146
 |
 |

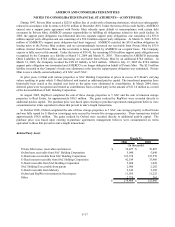
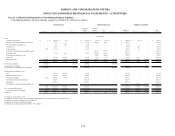
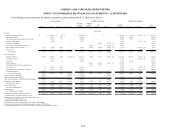
AMERCO AND CONSOLIDATED ENTITIES
NOTES TO CONSOLIDATED FINANCIAL STATEMENTS -- (CONTINUED)
F-46
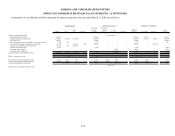
Consolidating income statements by industry segment for period ending March 31, 2006 are as follows:
AMERCO U-Haul Real Estate Eliminations
Moving &
Storage
Consolidated
Property &
Casualty
Insurance (a)
Life
Insurance (a) Eliminations
AMERCO
Consolidated SAC Holding II Eliminations
Total
Consolidated
Revenues:
Self-moving equipment rentals -$ 1,503,569$ -$ -$ 1,503,569$ -$ -$ -$ 1,503,569$ 9,498$ (9,498)$ (b) 1,503,569$
Self-storage revenues - 101,437 1,813 - 103,250 - - - 103,250 18,869 - 122,119
Self-moving & self-storage products & service sales - 207,119 - - 207,119 - - - 207,119 16,602 - 223,721
Property management fees - 23,988 - - 23,988 - - - 23,988 - (2,793) (g) 21,195
Life insurance premiums - - - - - - 120,352 (1,519) (c) 118,833 - - 118,833
Property and casualty insurance premiums - - - - - 26,001 - - (c) 26,001 - - 26,001
Net investment and interest income 5,108 24,894 23 - 30,025 11,357 21,964 (3,543) (d) 59,803 - (6,709) (d) 53,094
Other revenue 459 36,926 61,910 (66,778) (b) 32,517 - 5,764 (747) (b) 37,534 1,270 (710) (b) 38,094
Total revenues 5,567 1,897,933 63,746 (66,778) 1,900,468 37,358 148,080 (5,809) 2,080,097 46,239 (19,710) 2,106,626
Costs and expenses:
Operating expenses 12,722 1,085,602 6,197 (66,778) (b) 1,037,743 10,769 27,009 (14,647) (b,c) 1,060,874 22,909 (2,793) (g) 1,080,990
Commission expenses - 189,599 - - 189,599 - - - 189,599 - (9,498) (b) 180,101
Cost of sales - 105,872 - - 105,872 - - - 105,872 7,263 - 113,135
Benefits and losses - - - - - 22,590 85,732 8,838 (c) 117,160 - - 117,160
Amortization of deferred policy acquisition costs - - - - - 2,855 21,406 - 24,261 - - 24,261
Lease expense 81 143,344 66 - 143,491 - - - 143,491 - (710) (b) 142,781
Depreciation, net of (gains) losses on disposals 79 131,803 9,071 - 140,953 - - - 140,953 2,424 (560) (e) 142,817
Total costs and expenses 12,882 1,656,220 15,334 (66,778) 1,617,658 36,214 134,147 (5,809) 1,782,210 32,596 (13,561) 1,801,245
Equity in earnings of subsidiaries 163,004 - - (153,424) (f) 9,580 - - (9,580) (f) - - - -
Equity in earnings of SAC Holding II 384 - - - 384 - - - 384 - (384) (f) -
Total - equity in earnings of subsidiaries and SAC Holding II 163,388 - - (153,424) 9,964 - - (9,580) 384 - (384) -
Earnings from operations 156,073 241,713 48,412 (153,424) 292,774 1,144 13,933 (9,580) 298,271 13,643 (6,533) 305,381
Interest income (expense) (24,636) (14,383) (24,331) - (63,350) - - - (63,350) (12,840) 6,709 (d) (69,481)
Fees on early extinguishment of debt (35,627) - - - (35,627) - - - (35,627) - - (35,627)
Pretax earnings 95,810 227,330 24,081 (153,424) 193,797 1,144 13,933 (9,580) 199,294 803 176 200,273
Income tax benefit (expense) 24,996 (87,910) (10,077)
-
(72,991) (513) (4,984) - (78,488) (419) (212) (e) (79,119)
Net earnings 120,806 139,420 14,004 (153,424) 120,806 631 8,949 (9,580) 120,806 384 (36) 121,154
Less: Preferred stock dividends (12,963) - - - (12,963) - - - (12,963) - - (12,963)
Earnings available to common shareholders 107,843$ 139,420$ 14,004$ (153,424)$ 107,843$ 631$ 8,949$ (9,580)$ 107,843$ 384$ (36)$ 108,191$
(a) Balances for the year ended December 31, 2005
(b) Eliminate intercompany lease income and commission income
(c ) Eliminate intercompany premiums
(d) Eliminate intercompany interest on debt
(e) Eliminate gain on sale of surplus property from U-Haul to SAC Holding II
(f) Eliminate equity in earnings of subsidiaries and equity in earnings of SAC Holding II
(g) Eliminate management fees charged to SAC Holding II and other intercompany operating expenses
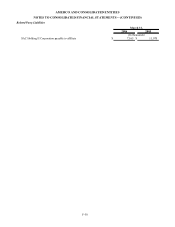
(In thousands)
Moving & Storage AMERCO Legal Group AMERCO as Consolidated