U-Haul 2006 Annual Report Download - page 119
Download and view the complete annual report
Please find page 119 of the 2006 U-Haul annual report below. You can navigate through the pages in the report by either clicking on the pages listed below, or by using the keyword search tool below to find specific information within the annual report.-
 1
1 -
2
-
3
-
4
-
5
-
6
-
7
-
8
-
9
-
10
-
11
-
12
-
13
-
14
-
15
-
16
-
17
-
18
-
19
-
20
-
21
-
22
-
23
-
24
-
25
-
26
-
27
-
28
-
29
-
30
-
31
-
32
-
33
-
34
-
35
-
36
-
37
-
38
-
39
-
40
-
41
-
42
-
43
-
44
-
45
-
46
-
47
-
48
-
49
-
50
-
51
-
52
-
53
-
54
-
55
-
56
-
57
-
58
-
59
-
60
-
61
-
62
-
63
-
64
-
65
-
66
-
67
-
68
-
69
-
70
-
71
-
72
-
73
-
74
-
75
-
76
-
77
-
78
-
79
-
80
-
81
-
82
-
83
-
84
-
85
-
86
-
87
-
88
-
89
-
90
-
91
-
92
-
93
-
94
-
95
-
96
-
97
-
98
-
99
-
100
-
101
-
102
-
103
-
104
-
105
-
106
-
107
-
108
-
 109
109 -
 110
110 -
 111
111 -
 112
112 -
 113
113 -
 114
114 -
 115
115 -
 116
116 -
 117
117 -
 118
118 -
 119
119 -
 120
120 -
 121
121 -
 122
122 -
 123
123 -
 124
124 -
 125
125 -
 126
126 -
 127
127 -
 128
128 -
 129
129 -
130
-
131
-
132
-
133
-
134
-
135
-
136
-
137
-
138
-
139
-
140
-
141
-
142
-
143
-
144
-
145
-
146
 |
 |
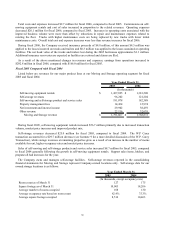
Oxford Life Insurance Company
2005 Compared with 2004
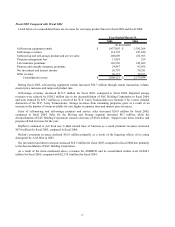
Premium revenues were $120.4 million and $127.7 million for the years ended December 31, 2005 and 2004,
respectively. Medicare supplement premiums decreased by $5.7 million due to lapses on closed lines being greater
than new business written on active lines. Credit insurance premiums decreased $3.8 million. Oxford is no longer
writing credit insurance. Oxford expects the majority of the existing credit policies to earn out over the next three
years. Life premiums increased $1.6 million primarily due to increased sales from the final expense product.
Annuitizations increased $0.4 million, while other health premiums increased slightly. Other income decreased $2.5
million in the current year, compared to the prior year primarily due to decreased surrender charge income.
Net investment income was $22.0 million and $23.5 million for 2005 and 2004, respectively. The decrease was
primarily due to realized losses on the sale of investments in the current year. Investment yields were consistent
between the two years.
Benefits and losses incurred were $85.7 million and $91.5 million for 2005 and 2004, respectively. This decrease
was primarily a result of a $5.4 million decrease in Medicare supplement benefits due to reduced exposure and a
slightly improved loss ratio. All other lines combined for a $0.4 million decrease.
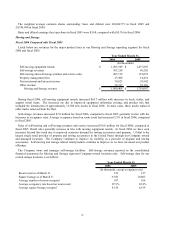
Amortization of deferred acquisition costs (DAC) and the value of business acquired (VOBA) was $21.4 million
and $23.8 million for 2005 and 2004, respectively. These costs are amortized for life and health policies as the
premium is earned over the term of the policy; and for deferred annuities in relation to interest spreads. Annuity
amortization decreased $1.9 million from 2004 primarily due to reduced surrender activity. Other segments
combined for a $0.5 million decrease primarily due to a decline in new business volume.
Operating expenses were $27.0 million and $42.2 million for 2005 and 2004, respectively. The decrease is
primarily due to a $10.6 million accrual in the prior year for the Kocher settlement as well as reduced legal and
overhead expenses in the current year. Included in operating expenses for the current year is $0.7 million of expense
related to the write-off of goodwill associated with a subsidiary engaged in selling credit insurance. Non-deferrable
commissions decreased $2.3 million due to decreased sales of Medicare supplement and credit products.
Earnings from operations were $13.9 million and $2.1 million for 2005 and 2004, respectively. The increase is
due primarily to the prior year accrual of $10.6 million related to the Kocher settlement as well as improved loss
ratios in the Medicare supplement and other health lines of business.
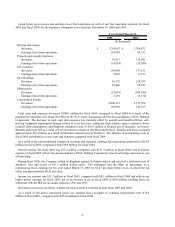
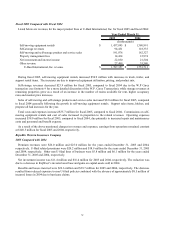
2004 Compared with 2003
Premiums revenues were $127.7 million, $147.8 million for the years ended December 31, 2004 and 2003,
respectively. Medicare supplement premiums decreased by $8.2 million from 2003 due to lapses on closed lines
being greater than new business written on active lines. Credit insurance premiums decreased $6.9 million from
2003 due to fewer accounts resulting from the rating downgrade by A.M. Best. Life, other health, and annuity
premiums decreased $5.0 million from 2003 primarily from reduced life insurance sales and fewer annuitizations.
Net investment income was $23.5 million and $19.0 million for 2004 and 2003, respectively.
Benefits and losses incurred were $91.5 million and $103.5 million for 2004 and 2003, respectively. Medicare
supplement benefits decreased $5.8 million from 2003 due primarily to reduced exposure. Credit insurance benefits
decreased $2.8 million from 2003 due to reduced exposure and improved disability experience. Life insurance
benefits decreased $3.6 million from 2003 as new business declined and existing exposure decreased. All other lines
had increases of $0.2 million from 2003.
36