U-Haul 2006 Annual Report Download - page 6
Download and view the complete annual report
Please find page 6 of the 2006 U-Haul annual report below. You can navigate through the pages in the report by either clicking on the pages listed below, or by using the keyword search tool below to find specific information within the annual report.-
 1
1 -
 2
2 -
 3
3 -
 4
4 -
 5
5 -
 6
6 -
 7
7 -
 8
8 -
 9
9 -
 10
10 -
 11
11 -
 12
12 -
 13
13 -
 14
14 -
 15
15 -
 16
16 -
 17
17 -
18
-
19
-
20
-
21
-
22
-
23
-
24
-
25
-
26
-
27
-
28
-
29
-
30
-
31
-
32
-
33
-
34
-
35
-
36
-
37
-
38
-
39
-
40
-
41
-
42
-
43
-
44
-
45
-
46
-
47
-
48
-
49
-
50
-
51
-
52
-
53
-
54
-
55
-
56
-
57
-
58
-
59
-
60
-
61
-
62
-
63
-
64
-
65
-
66
-
67
-
68
-
69
-
70
-
71
-
72
-
73
-
74
-
75
-
76
-
77
-
78
-
79
-
80
-
81
-
82
-
83
-
84
-
85
-
86
-
87
-
88
-
89
-
90
-
91
-
92
-
93
-
94
-
95
-
96
-
97
-
98
-
99
-
100
-
101
-
102
-
103
-
104
-
105
-
106
-
107
-
108
-
109
-
110
-
111
-
112
-
113
-
114
-
115
-
116
-
117
-
118
-
119
-
120
-
121
-
122
-
123
-
124
-
125
-
126
-
127
-
128
-
129
-
130
-
131
-
132
-
133
-
134
-
135
-
136
-
137
-
138
-
139
-
140
-
141
-
142
-
143
-
144
-
145
-
146
 |
 |

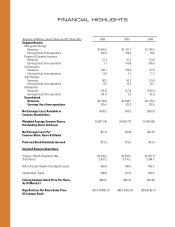
FINANCIALHIGHLIGHTS
Amounts in Millions, Except Share and Per Share Data 2006 2005 2004
Segment Results:
Moving and Storage
Revenues $1,900.5 $1,791.7 $1,768.9
Earnings (loss) from operations 292.8 166.0 93.6
Property & Casualty Insurance
Revenues 37.4 41.4 114.9
Earnings (loss) from operations 1.1 (14.8) (36.0)
Life Insurance
Revenues 148.1 159.5 177.8
Earnings (loss) from operations 13.9 2.1 11.3
SAC Holdings
Revenues 46.2 43.2 219.0
Earnings (loss) from operations 13.6 10.5 64.7
Eliminations
Revenues (25.5) (27.6) (104.6)
Earnings (loss) from operations (16.1) 3.3 (6.7)
Consolidated
Revenues $2,106.6 $2,008.1 $2,176.0
Earnings (loss) from operations 305.4 167.0 126.9
Net Earnings (Loss) Available to $108.2 $76.5 ($15.8)
Common Shareholders
Weighted Average Common Shares 20,857,108 20,804,773 20,749,998
Outstanding, Basic & Diluted
Net Earnings (Loss) Per $5.19 $3.68 ($0.76)
Common Share, Basic & Diluted
Preferred Stock Dividends Accrued $13.0 $13.0 $13.0
Selected Balance Sheet Data:
Property, Plant & Equipment, Net $1,535.2 $1,354.5 $1,451.8
Total Assets 3,367.2 3,116.2 3,394.7
Notes & Loans Payable Plus Capital Leases 965.6 780.0 962.3
Stockholders’ Equity 695.6 572.8 503.8
Closing Common Stock Price Per Share $98.97 $46.30 $23.60
As Of March 31
High And Low Per Share Sales Price $101.24-$42.75 $48.23-$19.76 $28.90-$3.10
Of Common Stock