U-Haul 2006 Annual Report Download - page 19
Download and view the complete annual report
Please find page 19 of the 2006 U-Haul annual report below. You can navigate through the pages in the report by either clicking on the pages listed below, or by using the keyword search tool below to find specific information within the annual report.-
 1
1 -
2
-
3
-
4
-
5
-
6
-
7
-
8
-
 9
9 -
 10
10 -
 11
11 -
 12
12 -
 13
13 -
 14
14 -
 15
15 -
 16
16 -
 17
17 -
 18
18 -
 19
19 -
 20
20 -
 21
21 -
 22
22 -
 23
23 -
 24
24 -
 25
25 -
 26
26 -
 27
27 -
 28
28 -
 29
29 -
30
-
31
-
32
-
33
-
34
-
35
-
36
-
37
-
38
-
39
-
40
-
41
-
42
-
43
-
44
-
45
-
46
-
47
-
48
-
49
-
50
-
51
-
52
-
53
-
54
-
55
-
56
-
57
-
58
-
59
-
60
-
61
-
62
-
63
-
64
-
65
-
66
-
67
-
68
-
69
-
70
-
71
-
72
-
73
-
74
-
75
-
76
-
77
-
78
-
79
-
80
-
81
-
82
-
83
-
84
-
85
-
86
-
87
-
88
-
89
-
90
-
91
-
92
-
93
-
94
-
95
-
96
-
97
-
98
-
99
-
100
-
101
-
102
-
103
-
104
-
105
-
106
-
107
-
108
-
109
-
110
-
111
-
112
-
113
-
114
-
115
-
116
-
117
-
118
-
119
-
120
-
121
-
122
-
123
-
124
-
125
-
126
-
127
-
128
-
129
-
130
-
131
-
132
-
133
-
134
-
135
-
136
-
137
-
138
-
139
-
140
-
141
-
142
-
143
-
144
-
145
-
146
 |
 |

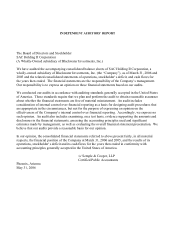
AMERCO AND CONSOLIDATED ENTITIES
NOTES TO CONSOLIDATED FINANCIAL STATEMENTS -- (CONTINUED)
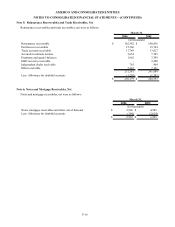
Inventories, net
Inventories were as follows:
2006 2005
Truck and trailer parts and accessories (a) $ 52,089 $ 50,095
Hitches and towing components (b) 13,766 12,199
Moving supplies and propane (b) 6,257 6,098
Subtotal 72,112 68,392
Less: LIFO reserves (5,693) (3,234)
Less: excess and obsolete reserves (1,500) (1,500)
Total $ 64,919 $ 63,658
(In thousands)
March 31,
(a) Primarily held for internal usage, including equipment manufacturing and repair
(b) Primarily held for retail sales
Inventories consist primarily of truck and trailer parts and accessories used to manufacture and repair rental equipment
as well as products and accessories available for retail sale. Inventory is held at Company-owned locations; our
independent dealers do not hold any of the Company’ s inventory.
Inventory cost is primarily determined using the last-in, first-out method (“LIFO”). Inventories valued using LIFO
consisted of approximately 95% and 93% of the total inventories for March 31, 2006 and 2005, respectively. Had the
Company utilized the first-in, first-out method (“FIFO”), stated inventory balances would have been $5.7 million and $3.2
million higher at March 31, 2006 and 2005, respectively. In fiscal 2006, the effect on income due to liquidation of a
portion of the LIFO inventory was $0.1 million. In fiscal 2006, the Company began utilizing the inventory price index
computation (“IPIC”) method of computing changes in LIFO pools compared to the internal index method used in prior
periods which is considered a preferable method and the effect of the change on current income is not considered material.
This change reduced the time and expense of the calculation without resulting in a material effect to the financial
statements.
Property, Plant and Equipment
Property, plant and equipment are stated at cost. Interest cost incurred during the initial construction of buildings and
rental equipment is considered part of cost. Depreciation is computed for financial reporting purposes using the straight-line
or an accelerated declining method based on a declining balances formula over the following estimated useful lives: rental
equipment 2-20 years and buildings and non-rental equipment 3-55 years. Major overhauls to rental equipment are
capitalized and are amortized over the estimated period benefited. Routine maintenance costs are charged to operating
expense as they are incurred. Gains and losses on dispositions of property, plant and equipment are netted against
depreciation expense when realized. The amount of loss netted against depreciation expense amounts to $9.2 million, $3.0
million and $3.9 million during fiscal 2006, 2005 and 2004, respectively. Depreciation is recognized in amounts expected
to result in the recovery of estimated residual values upon disposal, i.e., no gains or losses. During the first quarter of fiscal
2005, the Company lowered its estimates for residual values on new rental trucks and rental trucks purchased off TRAC
leases from 25% of the original cost to 20%. In determining the depreciation rate, historical disposal experience, holding
periods and trends in the market for vehicles are reviewed.
We regularly perform reviews to determine whether facts and circumstances exist which indicate that the carrying
amount of assets, including estimates of residual value, may not be recoverable or that the useful life of assets is shorter or
longer than originally estimated. Reductions in residual values (i.e., the price at which we ultimately expect to dispose of
revenue earning equipment) or useful lives will result in an increase in depreciation expense over the life of the equipment.
Reviews are performed based on vehicle class, generally subcategories of trucks and trailers. We assess the recoverability
of our assets by comparing the projected undiscounted net cash flows associated with the related asset or group of assets
over their estimated remaining lives against their respective carrying amounts. We consider factors such as current and
expected future market price trends on used vehicles and the expected life of vehicles included in the fleet. Impairment, if
any, is based on the excess of the carrying amount over the fair value of those assets. If assets are determined to be
recoverable, but the useful lives are shorter or longer than originally estimated, the net book value of the assets is
depreciated over the newly determined remaining useful lives.
F-12