U-Haul 2006 Annual Report Download - page 127
Download and view the complete annual report
Please find page 127 of the 2006 U-Haul annual report below. You can navigate through the pages in the report by either clicking on the pages listed below, or by using the keyword search tool below to find specific information within the annual report.-
 1
1 -
2
-
3
-
4
-
5
-
6
-
7
-
8
-
9
-
10
-
11
-
12
-
13
-
14
-
15
-
16
-
17
-
18
-
19
-
20
-
21
-
22
-
23
-
24
-
25
-
26
-
27
-
28
-
29
-
30
-
31
-
32
-
33
-
34
-
35
-
36
-
37
-
38
-
39
-
40
-
41
-
42
-
43
-
44
-
45
-
46
-
47
-
48
-
49
-
50
-
51
-
52
-
53
-
54
-
55
-
56
-
57
-
58
-
59
-
60
-
61
-
62
-
63
-
64
-
65
-
66
-
67
-
68
-
69
-
70
-
71
-
72
-
73
-
74
-
75
-
76
-
77
-
78
-
79
-
80
-
81
-
82
-
83
-
84
-
85
-
86
-
87
-
88
-
89
-
90
-
91
-
92
-
93
-
94
-
95
-
96
-
97
-
98
-
99
-
100
-
101
-
102
-
103
-
104
-
105
-
106
-
107
-
108
-
109
-
110
-
111
-
112
-
113
-
114
-
115
-
116
-
 117
117 -
 118
118 -
 119
119 -
 120
120 -
 121
121 -
 122
122 -
 123
123 -
 124
124 -
 125
125 -
 126
126 -
 127
127 -
 128
128 -
 129
129 -
 130
130 -
 131
131 -
 132
132 -
 133
133 -
 134
134 -
 135
135 -
 136
136 -
 137
137 -
138
-
139
-
140
-
141
-
142
-
143
-
144
-
145
-
146
 |
 |

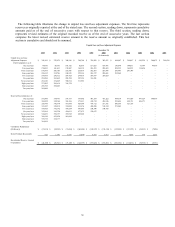
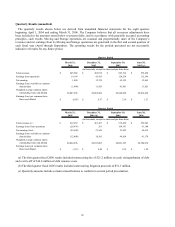
Quarterly Results (unaudited)
The quarterly results shown below are derived from unaudited financial statements for the eight quarters
beginning April 1, 2004 and ending March 31, 2006. The Company believes that all necessary adjustments have
been included in the amounts stated below to present fairly, and in accordance with generally accepted accounting
principles, such results. Moving and Storage operations are seasonal and proportionally more of the Company’ s
revenues and net earnings from its Moving and Storage operations are generated in the first and second quarters of
each fiscal year (April through September). The operating results for the periods presented are not necessarily
indicative of results for any future period.
March 31,
2006
December 31,
2005
September 30,
2005
June 30,
2005 (a)
Total revenues $ 445,982 $ 495,670 $ 605,516 $ 559,458
Earnings from operations 19,164 45,419 128,238 112,560
Net earnings 1,800 15,170 69,122 35,062
Earnings (loss) available to common
shareholders (1,440) 11,929 65,881 31,821
Weighted average common shares
outstanding: basic and diluted 20,887,258 20,865,684 20,848,620 20,836,458
Earnings (loss) per common share
Basic and diluted $ (0.07) $ 0.57 $ 3.16 $ 1.53
Quarter Ended
(In thousands, except for share and per share data)
March 31,
2005
December 31,
2004 (b)
September 30,
2004
June 30,
2004
Total revenues (c ) $ 414,259 $ 461,497 $ 579,420 $ 552,945
Earnings (loss) from operations (28,676) 291 104,193 91,188
Net earnings (loss) (29,600) 21,546 53,059 44,419
Earnings (loss) available to common
shareholders (32,840) 18,305 49,818 41,178
Weighted average common shares
outstanding: basic and diluted 20,824,296 20,813,805 20,801,525 20,788,074
Earnings (loss) per common share
Basic and diluted $ (1.57) $ 0.88 $ 2.39 $ 1.98
Quarter Ended
(In thousands, except for share and per share data)
(a) The first quarter fiscal 2006 results included nonrecurring fee of $21.2 million on early extinguishment of debt
and a write off of $14.4 million of debt issuance costs.
(b) The third quarter fiscal 2005 results included nonrecurring litigation proceeds of $51.3 million.
(c) Quarterly amounts include certain reclassifications to conform to current period presentation.
44