U-Haul 2006 Annual Report Download - page 26
Download and view the complete annual report
Please find page 26 of the 2006 U-Haul annual report below. You can navigate through the pages in the report by either clicking on the pages listed below, or by using the keyword search tool below to find specific information within the annual report.-
 1
1 -
2
-
3
-
4
-
5
-
6
-
7
-
8
-
9
-
10
-
11
-
12
-
13
-
14
-
15
-
 16
16 -
 17
17 -
 18
18 -
 19
19 -
 20
20 -
 21
21 -
 22
22 -
 23
23 -
 24
24 -
 25
25 -
 26
26 -
 27
27 -
 28
28 -
 29
29 -
 30
30 -
 31
31 -
 32
32 -
 33
33 -
 34
34 -
 35
35 -
 36
36 -
37
-
38
-
39
-
40
-
41
-
42
-
43
-
44
-
45
-
46
-
47
-
48
-
49
-
50
-
51
-
52
-
53
-
54
-
55
-
56
-
57
-
58
-
59
-
60
-
61
-
62
-
63
-
64
-
65
-
66
-
67
-
68
-
69
-
70
-
71
-
72
-
73
-
74
-
75
-
76
-
77
-
78
-
79
-
80
-
81
-
82
-
83
-
84
-
85
-
86
-
87
-
88
-
89
-
90
-
91
-
92
-
93
-
94
-
95
-
96
-
97
-
98
-
99
-
100
-
101
-
102
-
103
-
104
-
105
-
106
-
107
-
108
-
109
-
110
-
111
-
112
-
113
-
114
-
115
-
116
-
117
-
118
-
119
-
120
-
121
-
122
-
123
-
124
-
125
-
126
-
127
-
128
-
129
-
130
-
131
-
132
-
133
-
134
-
135
-
136
-
137
-
138
-
139
-
140
-
141
-
142
-
143
-
144
-
145
-
146
 |
 |

AMERCO AND CONSOLIDATED ENTITIES
NOTES TO CONSOLIDATED FINANCIAL STATEMENTS -- (CONTINUED)
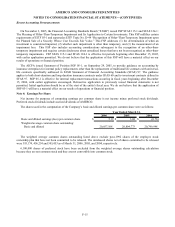
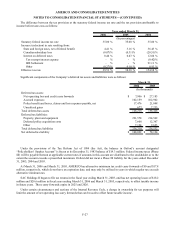
The Company sold available-for-sale securities with a fair value of $170.6 million in 2005, $167.5 million in 2004, and
$267.9 million in 2003. The gross realized gains on these sales totaled $5.1 million in 2005, $2.3 million in 2004 and $5.3
million in 2003. The Company realized gross losses on these sales of $3.3 million in 2005, $1.7 million in 2004 and $3.1
million in 2003.
The unrealized losses of more than twelve months in the above table are considered temporary declines. The Company
tracks each investment with an unrealized loss and evaluates them on an individual basis for other than temporary
impairments including obtaining corroborating opinions from third party sources, performing trend analysis and reviewing
underlying management’ s future plans. Certain of these investments had declines determined by management to be other
than temporary and the Company recognized these write-downs through earnings in the amounts of approximately $5.3
million in 2005, $4.3 million in 2004 and $5.0 million in 2003.
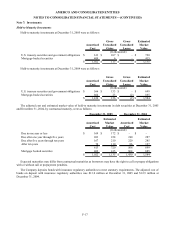
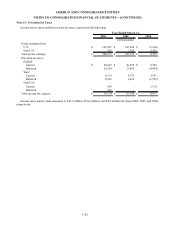
The adjusted cost and estimated market value of available-for-sale investments in debt securities at December 31, 2005
and December 31, 2004, by contractual maturity, were as follows:
Amortized
Cost
Estimated
Market
Value
Amortized
Cost
Estimated
Market
Value
Due in one year or less $ 58,593 $ 58,466 $ 110,679 $ 112,058
Due after one year through five years 216,188 216,119 181,455 185,890
Due after five years through ten years 154,656 154,490 109,108 113,076
After ten years 131,344 135,147 98,200 106,824
560,781 564,222 499,442 517,848
Mortgage backed securities 112,432 111,581 78,329 77,981
Redeemable preferred stocks 18,531 19,048 30,058 31,278
Equity securities 184 85 7,476 6,641
$ 691,928 $ 694,936 $ 615,305 $ 633,748
December 31, 2005 December 31, 2004
(In thousands)
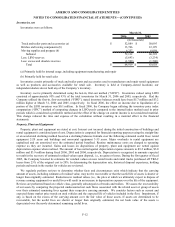
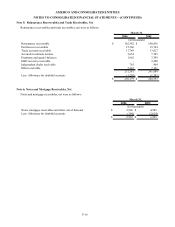
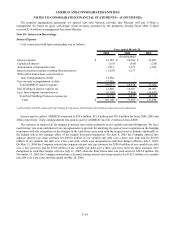
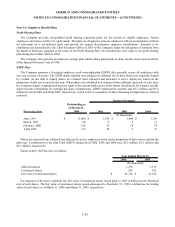
Investments, other
The carrying value of other investments was as follows:
2006 2005
Short-term investments $ 129,325 $ 193,525
Real estate 25,344 93,178
Mortgage loans, net 48,392 51,196
Policy loans 5,027 5,185
Other 1,273 2,123
$ 209,361 $ 345,207
March 31,
(In thousands)
Short-term investments primarily consist of securities with fixed maturities of three months to one year from acquisition
date.
Mortgage loans are carried at the unpaid balance, less an allowance for possible losses and any unamortized premium or
discount. The allowance for possible losses was $1.2 million and $1.0 million as of March 31, 2006 and 2005, respectively.
The estimated fair value of these loans as of March 31, 2006 and 2005, respectively approximated the carrying value. These
loans represent first lien mortgages held by the Company’ s insurance subsidiaries.
Real estate obtained through foreclosures and held for sale and equity investments are carried at the lower of cost or fair
market value.
Insurance policy loans are carried at their unpaid balance.
F-19