U-Haul 2006 Annual Report Download - page 25
Download and view the complete annual report
Please find page 25 of the 2006 U-Haul annual report below. You can navigate through the pages in the report by either clicking on the pages listed below, or by using the keyword search tool below to find specific information within the annual report.-
 1
1 -
2
-
3
-
4
-
5
-
6
-
7
-
8
-
9
-
10
-
11
-
12
-
13
-
14
-
 15
15 -
 16
16 -
 17
17 -
 18
18 -
 19
19 -
 20
20 -
 21
21 -
 22
22 -
 23
23 -
 24
24 -
 25
25 -
 26
26 -
 27
27 -
 28
28 -
 29
29 -
 30
30 -
 31
31 -
 32
32 -
 33
33 -
 34
34 -
 35
35 -
36
-
37
-
38
-
39
-
40
-
41
-
42
-
43
-
44
-
45
-
46
-
47
-
48
-
49
-
50
-
51
-
52
-
53
-
54
-
55
-
56
-
57
-
58
-
59
-
60
-
61
-
62
-
63
-
64
-
65
-
66
-
67
-
68
-
69
-
70
-
71
-
72
-
73
-
74
-
75
-
76
-
77
-
78
-
79
-
80
-
81
-
82
-
83
-
84
-
85
-
86
-
87
-
88
-
89
-
90
-
91
-
92
-
93
-
94
-
95
-
96
-
97
-
98
-
99
-
100
-
101
-
102
-
103
-
104
-
105
-
106
-
107
-
108
-
109
-
110
-
111
-
112
-
113
-
114
-
115
-
116
-
117
-
118
-
119
-
120
-
121
-
122
-
123
-
124
-
125
-
126
-
127
-
128
-
129
-
130
-
131
-
132
-
133
-
134
-
135
-
136
-
137
-
138
-
139
-
140
-
141
-
142
-
143
-
144
-
145
-
146
 |
 |

AMERCO AND CONSOLIDATED ENTITIES
NOTES TO CONSOLIDATED FINANCIAL STATEMENTS -- (CONTINUED)
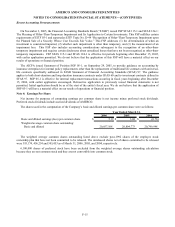
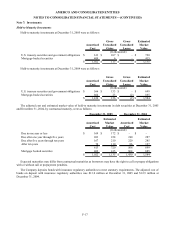
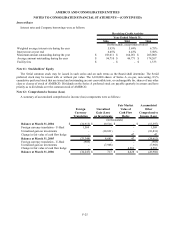
Available-for-Sale Investments
Available-for-sale investments at December 31, 2005 were as follows:
Amortized
Cost
Gross
Unrealized
Gains
Gross
Unrealized
Losses
More than
12 Months
Gross
Unrealized
Losses
Less than
12 Months
Estimated
Market
Value
U.S. treasury securities and government
obligations $ 55,075 $ 1,385 $ (126) $ (391) $ 55,943
U.S. government agency mortgage-backed
securities 45,480 573 (47) (219) 45,787
Obligations of states and political subdivisions 1,568 1 (24) (3) 1,542
Corporate securities 458,658 9,672 (3,538) (3,843) 460,949
Mortgage-backed securities 112,432 670 (641) (879) 111,582
Redeemable preferred stocks 18,531 517 - - 19,048
Common stocks 184 - (70) (29) 85
$ 691,928 $ 12,818 $ (4,446) $ (5,364) $ 694,936
(In thousands)
Available-for-sale investments at December 31, 2004 were as follows:
Amortized
Cost
Gross
Unrealized
Gains
Gross
Unrealized
Losses
More than
12 Months
Gross
Unrealized
Losses
Less than
12 Months
Estimated
Market
Value
U.S. treasury securities and government
obligations $ 28,249 $ 1,840 $ (28) $ (56) $ 30,005
U.S. government agency mortgage-backed
securities 9,718 344 - - 10,062
Obligations of states and political subdivisions 788 22 - - 810
Corporate securities 460,687 20,861 (3,303) (1,274) 476,971
Mortgage-backed securities 78,329 1,752 (1,931) (169) 77,981
Redeemable preferred stocks 30,058 1,220 - - 31,278
Common stocks 7,476 46 - (881) 6,641
$
615,305
$
26,085
$
(
5,262
)
$
(
2,380
)
$
633,748
(In thousands)
The above tables include gross unrealized losses that are not deemed to be other-than-temporarily impaired, aggregated
by investment category and length of time that individual securities have been in a continuous unrealized loss position.
F-18