U-Haul 2006 Annual Report Download - page 14
Download and view the complete annual report
Please find page 14 of the 2006 U-Haul annual report below. You can navigate through the pages in the report by either clicking on the pages listed below, or by using the keyword search tool below to find specific information within the annual report.-
 1
1 -
2
-
3
-
 4
4 -
 5
5 -
 6
6 -
 7
7 -
 8
8 -
 9
9 -
 10
10 -
 11
11 -
 12
12 -
 13
13 -
 14
14 -
 15
15 -
 16
16 -
 17
17 -
 18
18 -
 19
19 -
 20
20 -
 21
21 -
 22
22 -
 23
23 -
 24
24 -
25
-
26
-
27
-
28
-
29
-
30
-
31
-
32
-
33
-
34
-
35
-
36
-
37
-
38
-
39
-
40
-
41
-
42
-
43
-
44
-
45
-
46
-
47
-
48
-
49
-
50
-
51
-
52
-
53
-
54
-
55
-
56
-
57
-
58
-
59
-
60
-
61
-
62
-
63
-
64
-
65
-
66
-
67
-
68
-
69
-
70
-
71
-
72
-
73
-
74
-
75
-
76
-
77
-
78
-
79
-
80
-
81
-
82
-
83
-
84
-
85
-
86
-
87
-
88
-
89
-
90
-
91
-
92
-
93
-
94
-
95
-
96
-
97
-
98
-
99
-
100
-
101
-
102
-
103
-
104
-
105
-
106
-
107
-
108
-
109
-
110
-
111
-
112
-
113
-
114
-
115
-
116
-
117
-
118
-
119
-
120
-
121
-
122
-
123
-
124
-
125
-
126
-
127
-
128
-
129
-
130
-
131
-
132
-
133
-
134
-
135
-
136
-
137
-
138
-
139
-
140
-
141
-
142
-
143
-
144
-
145
-
146
 |
 |

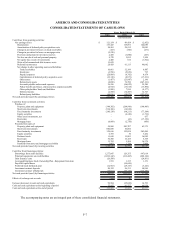
AMERCO AND CONSOLIDATED ENTITIES
CONSOLIDATED STATEMENTS OF CASH FLOWS
2006 2005 2004
Cash flows from o
p
eratin
g
activities:
Net earnin
g
s
(
loss
)
$ 121,154 $ 89,424 $
(
2,852
)
De
p
reciation 133,447 118,091 144,889
Amortization of deferred
p
olic
y
ac
q
uisition costs 24,261 28,512 39,083
Chan
g
e in
p
rovision for losses on trade receivables
(
183
)
(
506
)
(
271
)
Chan
g
e in
p
rovision for losses on mort
g
a
g
e notes
(
2,230
)
- -
Provision
(
reduction
)
for inventor
y
reserves 2,458
(
1,000
)
(
267
)
Net loss on sale of real and
p
ersonal
p
ro
p
ert
y
9,370 3,012 3,924
Net
(g
ain
)
loss on sale of investments 2,408 616
(
1,962
)
Write-off of unamortized debt issuance costs 13,629 - -
Deferred income taxes 28,429 61,113 96,042
Net chan
g
e in other o
p
eratin
g
assets and liabilities:
Trade receivables 10,661 32,189 6,887
Inventories
(
3,596
)
(
9,856
)
735
Pre
p
aid ex
p
enses
(
28,809
)
(
6,702
)
8,674
Ca
p
italization of deferred
p
olic
y
ac
q
uistion costs
(
12,110
)
(
8,873
)
(
17,231
)
Other assets
(
1,457
)
(
23,887
)
2,196
Related
p
art
y
assets
(
8,090
)
74,780
(
247,161
)
Accounts
p
a
y
able and accrued ex
p
enses 36,596
(
96,022
)
39,280
Polic
y
benefits and losses, claims and loss ex
p
enses
p
a
y
able
(
4,918
)
(
15,618
)
(
15,894
)
Other
p
olic
y
holders' funds and liabilities
(
3,908
)
7,910
(
8,577
)
Deferred income
(
2,588
)
(
14,407
)
12,763
Related
p
art
y
liabilities
(
44,016
)
(
18,079
)
(
123,076
)
Net cash
p
rovided
(
used
)
b
y
o
p
eratin
g
activities 270,508 220,697
(
62,818
)
Cash flow from investment activities:
Purchase of:
Pro
p
ert
y
,
p
lant and e
q
ui
p
ment
(
344,382
)
(
284,966
)
(
198,443
)
Short term investments
(
534,106
)
(
16,830
)
-
Fixed maturit
y
investments
(
260,138
)
(
98,211
)
(
77,384
)
E
q
uit
y
securities -
(
6,349
)
(
1,736
)
Other asset investments, net - - 637
Real estate -
(
63
)
(
17,156
)
Mort
g
a
g
e loans
(
8,868
)
(
2,750
)
(
450
)
Proceeds from sales of:
Pro
p
ert
y
,
p
lant and e
q
ui
p
ment 59,960 243,707 63,175
Short term investments 600,850 10,866 -
Fixed maturit
y
investments 159,616 152,024 243,490
E
q
uit
y
securities 6,769 56 3,452
Preferred stock 11,650 15,803 16,882
Real estate 36,388 16,185 6,338
Mort
g
a
g
e loans 11,762 5,368 16,374
Pa
y
ments from notes and mort
g
a
g
e receivables 1,663 1,336 5,008
Net cash
p
rovided
(
used
)
b
y
investin
g
activities
(
258,836
)
36,176 60,187
Cash flow from financin
g
activities:
Borrowin
g
s from credit facilities 1,277,047 129,355 997,014
Princi
p
al re
p
a
y
ments on credit facilties
(
1,093,342
)
(
213,405
)
(
888,184
)
Debt issuance costs
(
29,588
)
-
(
24,831
)
Levera
g
ed Em
p
lo
y
ee Stock Ownershi
p
Plan - Re
p
a
y
ment from loan 1,553 1,135 1,151
Pa
y
off of ca
p
ital leases -
(
99,609
)
-
Preferred stock dividends
p
aid
(
12,963
)
(
29,167
)
(
3,241
)
Investment contract de
p
osits 20,322 26,331 50,990
Investment contract withdrawals
(
75,011
)
(
97,137
)
(
115,530
)
Net cash
p
rovided
(
used
)
b
y
financin
g
activities 88,018
(
282,497
)
17,369
Effects of exchan
g
e rate on cash
(
186
)
22
(
15
)
Increase
(
decrease
)
in cash and cash e
q
uivalents 99,504
(
25,602
)
14,723
Cash and cash e
q
uivalents at the be
g
innin
g
of
p
eriod 55,955 81,557 66,834
Cash and cash equivalents at the end of period $ 155,459 $ 55,955 $ 81,557
(In thousands)
Years Ended March 31,
The accompanying notes are an integral part of these consolidated financial statements.
F-7