U-Haul 2006 Annual Report Download - page 110
Download and view the complete annual report
Please find page 110 of the 2006 U-Haul annual report below. You can navigate through the pages in the report by either clicking on the pages listed below, or by using the keyword search tool below to find specific information within the annual report.-
 1
1 -
2
-
3
-
4
-
5
-
6
-
7
-
8
-
9
-
10
-
11
-
12
-
13
-
14
-
15
-
16
-
17
-
18
-
19
-
20
-
21
-
22
-
23
-
24
-
25
-
26
-
27
-
28
-
29
-
30
-
31
-
32
-
33
-
34
-
35
-
36
-
37
-
38
-
39
-
40
-
41
-
42
-
43
-
44
-
45
-
46
-
47
-
48
-
49
-
50
-
51
-
52
-
53
-
54
-
55
-
56
-
57
-
58
-
59
-
60
-
61
-
62
-
63
-
64
-
65
-
66
-
67
-
68
-
69
-
70
-
71
-
72
-
73
-
74
-
75
-
76
-
77
-
78
-
79
-
80
-
81
-
82
-
83
-
84
-
85
-
86
-
87
-
88
-
89
-
90
-
91
-
92
-
93
-
94
-
95
-
96
-
97
-
98
-
99
-
 100
100 -
 101
101 -
 102
102 -
 103
103 -
 104
104 -
 105
105 -
 106
106 -
 107
107 -
 108
108 -
 109
109 -
 110
110 -
 111
111 -
 112
112 -
 113
113 -
 114
114 -
 115
115 -
 116
116 -
 117
117 -
 118
118 -
 119
119 -
 120
120 -
121
-
122
-
123
-
124
-
125
-
126
-
127
-
128
-
129
-
130
-
131
-
132
-
133
-
134
-
135
-
136
-
137
-
138
-
139
-
140
-
141
-
142
-
143
-
144
-
145
-
146
 |
 |

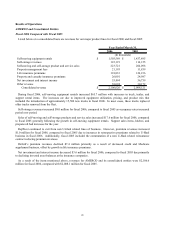
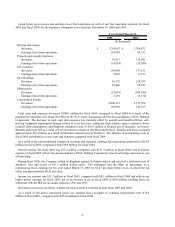
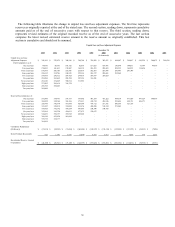
Fiscal 2005 Compared with Fiscal 2004
Listed below on a consolidated basis are revenues for our major product lines for fiscal 2005 and fiscal 2004:
2005 2004
Self-moving equipment rentals $ 1,437,895 $ 1,381,208
Self-storage revenues 114,155 247,640
Self-moving and self-storage product and service sales 206,098 232,965
Property management fees 11,839 259
Life insurance premiums 126,236 145,082
Property and casualty insurance premiums 24,987 92,036
Net investment and interest income 56,739 38,281
Other revenue 30,172 38,523
Consolidated revenue $ 2,008,121 $ 2,175,994
(In thousands)
Year Ended March 31,
During fiscal 2005, self-moving equipment rentals increased $56.7 million through steady transaction volume,
modest price increases and improved product mix.
Self-storage revenues decreased $133.5 million for fiscal 2005, compared to fiscal 2004. Reported storage
revenues were reduced by $109.2 million due to the deconsolidation of SAC Holding Corporation in fiscal 2004,
and were reduced by $29.7 million as a result of the W.P. Carey Transactions (see footnote 9 for a more detailed
discussion of the W.P. Carey Transactions). Storage revenues from remaining properties grew as a result of an
increase in the number of rooms available for rent, higher occupancy rates and modest price increases.
Sales of self-moving and self-storage products and service sales decreased $26.9 million for fiscal 2005,
compared to fiscal 2004. Sales for the Moving and Storage segment increased $8.7 million, while the
deconsolidation of SAC Holding Corporation caused a decrease of $36.0 million. Support sales items, hitches, and
propane all had increases for the year.
RepWest continued to exit from non U-Haul related lines of business as a result premium revenues decreased
$67.0 million for fiscal 2005, compared to fiscal 2004.
Oxford’ s premium revenues declined $18.8 million primarily as a result of the lingering effects of its rating
downgrade by A.M. Best in 2003.
Net investment and interest income increased $18.5 million for fiscal 2005, compared to fiscal 2004 due primarily
to the deconsolidation of SAC Holding Corporation.
As a result of the items mentioned above, revenues for AMERCO and its consolidated entities were $2,008.1
million for fiscal 2005, compared with $2,176.0 million for fiscal 2004.
27