U-Haul 2006 Annual Report Download - page 121
Download and view the complete annual report
Please find page 121 of the 2006 U-Haul annual report below. You can navigate through the pages in the report by either clicking on the pages listed below, or by using the keyword search tool below to find specific information within the annual report.-
 1
1 -
2
-
3
-
4
-
5
-
6
-
7
-
8
-
9
-
10
-
11
-
12
-
13
-
14
-
15
-
16
-
17
-
18
-
19
-
20
-
21
-
22
-
23
-
24
-
25
-
26
-
27
-
28
-
29
-
30
-
31
-
32
-
33
-
34
-
35
-
36
-
37
-
38
-
39
-
40
-
41
-
42
-
43
-
44
-
45
-
46
-
47
-
48
-
49
-
50
-
51
-
52
-
53
-
54
-
55
-
56
-
57
-
58
-
59
-
60
-
61
-
62
-
63
-
64
-
65
-
66
-
67
-
68
-
69
-
70
-
71
-
72
-
73
-
74
-
75
-
76
-
77
-
78
-
79
-
80
-
81
-
82
-
83
-
84
-
85
-
86
-
87
-
88
-
89
-
90
-
91
-
92
-
93
-
94
-
95
-
96
-
97
-
98
-
99
-
100
-
101
-
102
-
103
-
104
-
105
-
106
-
107
-
108
-
109
-
110
-
 111
111 -
 112
112 -
 113
113 -
 114
114 -
 115
115 -
 116
116 -
 117
117 -
 118
118 -
 119
119 -
 120
120 -
 121
121 -
 122
122 -
 123
123 -
 124
124 -
 125
125 -
 126
126 -
 127
127 -
 128
128 -
 129
129 -
 130
130 -
 131
131 -
132
-
133
-
134
-
135
-
136
-
137
-
138
-
139
-
140
-
141
-
142
-
143
-
144
-
145
-
146
 |
 |

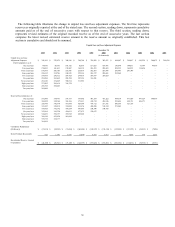
During March 2004, SAC Holding Corporation ceased to be a VIE and AMERCO ceased being the primary
beneficiary of SAC Holding Corporation. As a result of this, AMERCO deconsolidated its interests in SAC Holding
Corporation at that time. AMERCO remains the primary beneficiary of its contractual variable interests in SAC
Holding II Corporation for fiscal 2005 and 2004.
Revenues for fiscal 2005 fell $175.8 million, primarily as a result of the above mentioned deconsolidation.
Total costs and expenses were $32.7 million in fiscal 2005, compared with $154.3 million in fiscal 2004. Total
costs and expenses fell $121.6 million, primarily as a result of the above mentioned deconsolidation.
Earnings from operations were $10.5 million in fiscal 2005 compared with $64.7 million in fiscal 2004. Earnings
from operations fell $54.2 million in fiscal 2005 compared with fiscal 2004, primarily as a result of the above
mentioned deconsolidation.
Liquidity and Capital Resources
We believe that our current capital structure will allow us to achieve our operational plans and goals, and provide
us with sufficient liquidity for the next three to five years. The majority of the debt obligations currently in place
mature in fiscal 2010 or 2015. This allows us to focus on our operations and business to further improve liquidity in
the long term. We believe that these improvements will enhance our access to capital markets. However, there is no
assurance that future cash flows will be sufficient to meet our outstanding obligations or our future capital needs.
Our financial condition remains strong. At March 31, 2006, cash and short-term investments totaled $155.5
million, compared with $56.0 million at March 31, 2005. Total short-term and long-term debt, were $965.6 million
at March 31, 2006, compared with $780.0 million at March 31, 2005, and represented 1.4 times stockholders’ equity
for both periods.
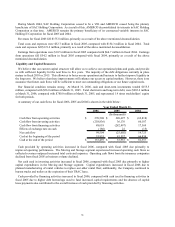
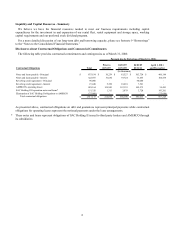
A summary of our cash flows for fiscal 2006, 2005 and 2004 is shown in the table below:
2006 2005 2004
Cash flow from operating activities $ 270,508 $ 220,697 $ (62,818)
Cash flow from investing activities (258,836) 36,176 60,187
Cash flow from financing activities 88,018 (282,497) 17,369
Effects of exchange rate on cash (186) 22 (15)
Net cash flow 99,504 (25,602) 14,723
Cash at the beginning of the period 55,955 81,557 66,834
Cash at the end of the period $ 155,459 $ 55,955 $ 81,557
Year Ended March 31,
(In thousands)
Cash provided by operating activities increased in fiscal 2006, compared with fiscal 2005 due primarily to
improved operating performance. The Moving and Storage segment experienced increased operating cash flows as
collected revenues outpaced increased total costs and expenses. Operating cash flows from the insurance companies
declined from fiscal 2005 as business volume declined.
Net cash used in investing activities increased in fiscal 2006, compared with fiscal 2005 due primarily to higher
capital expenditures in the Moving and Storage segment. Capital expenditures increased in fiscal 2006 due to
planned manufacturing of rental vehicles to replace our older rental fleet; additionally, the Company continued to
buyout trucks and trailers at the expiration of their TRAC lease.
Cash provided by financing activities increased in fiscal 2006, compared with cash used in financing activities in
fiscal 2005 due to higher debt borrowings used to fund increased capital requirements and the absence of capital
lease payments also contributed to the overall increase of cash provided by financing activities.
38