U-Haul 2006 Annual Report Download - page 58
Download and view the complete annual report
Please find page 58 of the 2006 U-Haul annual report below. You can navigate through the pages in the report by either clicking on the pages listed below, or by using the keyword search tool below to find specific information within the annual report.-
 1
1 -
2
-
3
-
4
-
5
-
6
-
7
-
8
-
9
-
10
-
11
-
12
-
13
-
14
-
15
-
16
-
17
-
18
-
19
-
20
-
21
-
22
-
23
-
24
-
25
-
26
-
27
-
28
-
29
-
30
-
31
-
32
-
33
-
34
-
35
-
36
-
37
-
38
-
39
-
40
-
41
-
42
-
43
-
44
-
45
-
46
-
47
-
 48
48 -
 49
49 -
 50
50 -
 51
51 -
 52
52 -
 53
53 -
 54
54 -
 55
55 -
 56
56 -
 57
57 -
 58
58 -
 59
59 -
 60
60 -
 61
61 -
 62
62 -
 63
63 -
 64
64 -
 65
65 -
 66
66 -
 67
67 -
 68
68 -
69
-
70
-
71
-
72
-
73
-
74
-
75
-
76
-
77
-
78
-
79
-
80
-
81
-
82
-
83
-
84
-
85
-
86
-
87
-
88
-
89
-
90
-
91
-
92
-
93
-
94
-
95
-
96
-
97
-
98
-
99
-
100
-
101
-
102
-
103
-
104
-
105
-
106
-
107
-
108
-
109
-
110
-
111
-
112
-
113
-
114
-
115
-
116
-
117
-
118
-
119
-
120
-
121
-
122
-
123
-
124
-
125
-
126
-
127
-
128
-
129
-
130
-
131
-
132
-
133
-
134
-
135
-
136
-
137
-
138
-
139
-
140
-
141
-
142
-
143
-
144
-
145
-
146
 |
 |

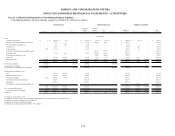
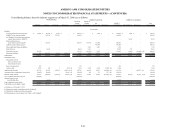
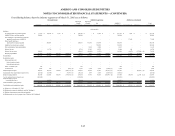
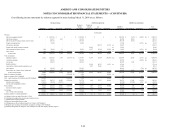
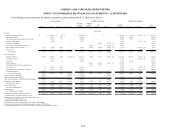
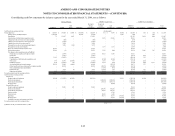
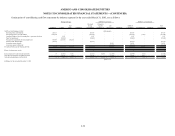
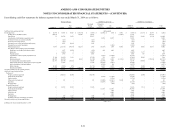
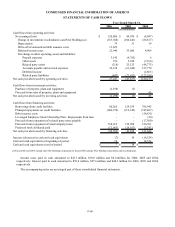
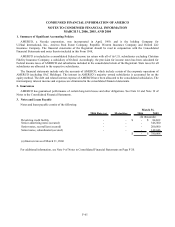
AMERCO AND CONSOLIDATED ENTITIES
NOTES TO CONSOLIDATED FINANCIAL STATEMENTS -- (CONTINUED)
F-51
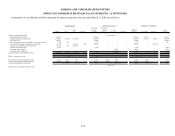
Consolidating cash flow statements by industry segment for the year ended March 31, 2005, are as follows:
AMERCO U-Haul
Real
Estate Elimination
Moving &
Storage
Consolidated
Property &
Casualty
Insurance (a)
Life
Insurance (a) Elimination
AMERCO
Consolidated SAC Holding II Elimination
Total
Consolidated
89,076$ 96,980$ 20,155$ (117,135)$ 89,076$ (9,710)$ 1,248$ 8,462$ 89,076$ (2,232)$ 2,580$ 89,424$
(106,441) - - 117,135 10,694 - - (8,462) 2,232 - (2,232) -
31 107,234 8,603 - 115,868 - - - 115,868 2,783 (560) 118,091
- - - - - 4,711 23,801 - 28,512 - - 28,512
- (620) - - (620) - - - (620) 114 - (506)
- (1,000) - - (1,000) - - - (1,000) - - (1,000)
- 6,804 (3,792) - 3,012 - - - 3,012 - - 3,012
- - - - - 577 39 - 616 - - 616
33,060 - - - 33,060 (3,740) (13,649) 46,947 62,618 (1,505) - 61,113
- 4,730 14,830 - 19,560 11,926 703 - 32,189 - - 32,189
- (9,567) - - (9,567) - - - (9,567) (289) - (9,856)
(4,782) (1,918) 2 - (6,698) - - - (6,698) (4) - (6,702)
- - - - - (2,141) (6,732) - (8,873) - - (8,873)
5,388 (28,134) (1,727) - (24,473) (250) 442 - (24,281) 394 - (23,887)
23,123 (6,069) 701 41,674 59,429 18,377 17,955 (15,610) 80,151 (2,204) (3,167) 74,780
(61,640) (13,864) (413) - (75,917) (734) (19,846) - (96,497) 475 - (96,022)
- 42,458 - - 42,458 (45,211) (12,865) - (15,618) - - (15,618)
- - - - - (2,700) 10,610 - 7,910 - - 7,910
- (11,329) (34) - (11,363) (3,086) - - (14,449) 42 - (14,407)
(21,652) 47,024 (754) (41,674) (17,056) 377 23,067 (31,337) (24,949) 3,491 3,379 (18,079)
(43,837) 232,729 37,571 - 226,463 (31,604) 24,773 - 219,632 1,065 - 220,697
(3) (280,141) (4,267) - (284,411) - - - (284,411) (555) - (284,966)
- - - - - (16,830) - - (16,830) - - (16,830)
- - - - - (4,992) (93,219) - (98,211) - - (98,211)
- - - - - - (6,349) - (6,349) - - (6,349)
- - - - - - (63) - (63) - - (63)
- - - - - - (2,750) - (2,750) - - (2,750)
- 232,691 11,016 - 243,707 - - - 243,707 - - 243,707
- - - - - - 10,866 - 10,866 - - 10,866
- - - - - 36,336 115,688 - 152,024 - - 152,024
- - - - - 56 - - 56 - - 56
- - - - - 12,000 3,803 - 15,803 - - 15,803
- - - - - 15,672 513 - 16,185 - - 16,185
- - - - - - 5,368 - 5,368 - - 5,368
- 717 619 - 1,336 - - - 1,336 - - 1,336
(3) (46,733) 7,368 - (39,368) 42,242 33,857 - 36,731 (555) - 36,176
Cash flows from operating activities:
Net earnings (loss)
Earnings from consolidated entities
Depreciation
Amortization of deferred policy acquisition costs
Provision for losses on accounts receivables
Provision for inventory reserves
AMERCO Legal Group AMERCO as ConsolidatedMoving & Storage
(In thousands)
(page 1 of 2)
Net (gain) loss on sale of real and personal property
Net (gain) loss on sale of investments
Deferred income taxes
Net change in other operating assets and liabilities:
Reinsurance recoverables and trade receivables
Inventories
Prepaid expenses
Capitalization of deferred policy acquisition costs
Other assets
Related party assets
Accounts payable and accrued expenses
Policy benefits and losses, claims and loss expenses payable
Other policyholders' funds and liabilities
Deferred income
Related party liabilities
Net cash provided (used) by operating activities
Cash flows from investing activities:
Short term investments
Fixed maturity investments
Mortgage loans
Purchases of:
Property, plant and equipment
Proceeds from sales of:
Equity securities
Real estate
Property, plant and equipment
Short term investments
Fixed maturity investments
Equity securities
Preferred stock
Real estate
Mortgage loans
Payments from notes and mortgage receivables
Net cash provided (used) by investing activities
(a) Balance for the year ended December 31, 2004