Tyson Foods 2008 Annual Report Download - page 66
Download and view the complete annual report
Please find page 66 of the 2008 Tyson Foods annual report below. You can navigate through the pages in the report by either clicking on the pages listed below, or by using the keyword search tool below to find specific information within the annual report.-
 1
1 -
2
-
3
-
4
-
5
-
6
-
7
-
8
-
9
-
10
-
11
-
12
-
13
-
14
-
15
-
16
-
17
-
18
-
19
-
20
-
21
-
22
-
23
-
24
-
25
-
26
-
27
-
28
-
29
-
30
-
31
-
32
-
33
-
34
-
35
-
36
-
37
-
38
-
39
-
40
-
41
-
42
-
43
-
44
-
45
-
46
-
47
-
48
-
49
-
50
-
51
-
52
-
53
-
54
-
55
-
 56
56 -
 57
57 -
 58
58 -
 59
59 -
 60
60 -
 61
61 -
 62
62 -
 63
63 -
 64
64 -
 65
65 -
 66
66 -
 67
67 -
 68
68 -
 69
69 -
 70
70 -
 71
71 -
 72
72
 |
 |

64 Tyson Foods, Inc.
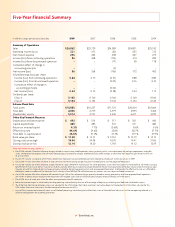
Five-Year Financial Summary
in millions, except per share and ratio data 2008 2007 2006 2005 2004
Summary of Operations
Sales $26,862 $25,729 $24,589 $24,801 $25,192
Operating income (loss) 331 613 (50) 655 733
Net interest expense 206 224 238 227 275
Income (loss) from continuing operations 86 268 (174) 314 285
Income (loss) from discontinued operation – – (17) 58 118
Cumulative effect of change in
accounting principle – – (5) – –
Net income (loss) 86 268 (196) 372 403
Diluted earnings (loss) per share:
Income (loss) from continuing operations 0.24 0.75 (0.51) 0.88 0.80
Income (loss) from discontinued operation – – (0.05) 0.16 0.33
Cumulative effect of change in
accounting principle – – (0.02) – –
Net income (loss) 0.24 0.75 (0.58) 1.04 1.13
Dividends per share:
Class A 0.160 0.160 0.160 0.160 0.160
Class B 0.144 0.144 0.144 0.144 0.144
Balance Sheet Data
Total assets $10,850 $10,227 $11,121 $10,504 $10,464
Total debt 2,896 2,779 3,979 2,995 3,362
Shareholders’ equity 5,014 4,731 4,440 4,671 4,292
Other Key Financial Measures
Depreciation and amortization $ 493 $ 514 $ 517 $ 501 $ 490
Capital expenditures 425 285 531 571 486
Return on invested capital 4.3% 7.7% (0.6)% 8.6% 9.6%
Effective tax rate 44.6% 34.6% 35.0% 28.7% 37.7%
Total debt to capitalization 36.6% 37.0% 47.3% 39.1% 43.9%
Book value per share $ 13.28 $ 13.31 $ 12.51 $ 13.19 $ 12.19
Closing stock price high 19.44 24.08 18.70 19.47 21.06
Closing stock price low 12.14 14.20 12.92 14.12 12.59
Notes to Five-Year Financial Summary
a. Fiscal 2008 includes $76 million of pretax charges related to: restructuring a beef operation; closing a poultry plant; asset impairments for packaging equipment, intangible
assets, unimproved real property and software; fl ood damage; and severance charges. Additionally, fi scal 2008 includes an $18 million non-operating gain related to the sale
of an investment.
b. Fiscal 2007 includes tax expense of $17 million related to a fi xed asset tax cost correction, primarily related to a fi xed asset system conversion in 1999.
c. Fiscal 2006 includes $63 million of pretax charges primarily related to closing one poultry plant, two beef plants and two prepared foods plants.
d. Fiscal 2005 includes $33 million of pretax charges related to a legal settlement involving our live swine operations, a non-recurring income tax net benefi t of $15 million including
benefi t from the reversal of certain income tax reserves, partially offset by an income tax charge related to the one-time repatriation of foreign income under the American Jobs
Creation Act and $14 million of pretax charges primarily related to closing two poultry plants and one prepared foods plant. Additionally, the effective tax rate was affected by
the federal income tax effect of the Medicare Part D subsidy in fi scal 2005 of $55 million because this amount was not subject to federal income tax.
e. Fiscal 2004 includes $61 million of pretax BSE-related charges, $40 million of pretax charges primarily related to closing one poultry and three prepared foods operations,
$25 million of pretax charges related to the impairment of intangible assets and $21 million of pretax charges related to fi xed asset write-downs.
f. Fiscal 2004 was a 53-week year, while the other years presented were 52-week years.
g. Return on invested capital is calculated by dividing operating income (loss) by the sum of the average of beginning and ending total debt and shareholders’ equity.
h. The 2006 total debt to capitalization ratio is not adjusted for the $750 million short-term investment we had on deposit at September 30, 2006. When adjusted for the
$750 million short-term investment, the debt to capitalization ratio was 42.1%.
i. In June 2008, we executed a letter of intent to sell the beef processing, cattle feed yard and fertilizer assets of Lakeside Farm Industries Ltd. We are reporting Lakeside as a
discontinued operation for all periods presented.