Tyson Foods 2008 Annual Report Download - page 59
Download and view the complete annual report
Please find page 59 of the 2008 Tyson Foods annual report below. You can navigate through the pages in the report by either clicking on the pages listed below, or by using the keyword search tool below to find specific information within the annual report.-
 1
1 -
2
-
3
-
4
-
5
-
6
-
7
-
8
-
9
-
10
-
11
-
12
-
13
-
14
-
15
-
16
-
17
-
18
-
19
-
20
-
21
-
22
-
23
-
24
-
25
-
26
-
27
-
28
-
29
-
30
-
31
-
32
-
33
-
34
-
35
-
36
-
37
-
38
-
39
-
40
-
41
-
42
-
43
-
44
-
45
-
46
-
47
-
48
-
 49
49 -
 50
50 -
 51
51 -
 52
52 -
 53
53 -
 54
54 -
 55
55 -
 56
56 -
 57
57 -
 58
58 -
 59
59 -
 60
60 -
 61
61 -
 62
62 -
 63
63 -
 64
64 -
 65
65 -
 66
66 -
 67
67 -
 68
68 -
 69
69 -
70
-
71
-
72
 |
 |

57 2008 Annual Report
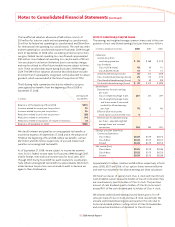
Notes to Consolidated Financial Statements (continued)
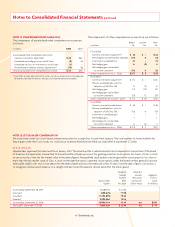
In the fourth quarter fi scal 2008, we began to manage and report the
operating results and identifi able assets of our logistics operations in
the segment in which the product being moved relates. As a result,
our operating segments now refl ect logistics operations which were
previously included in Other. All prior periods have been restated to
refl ect this change.
We allocate expenses related to corporate activities to the segments,
while the related assets and additions to property, plant and equip-
ment remain in Other.
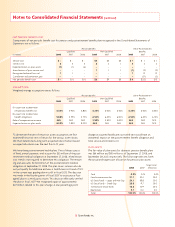
The Pork segment had sales of $517 million, $515 million and $467 million
for fi scal years 2008, 2007 and 2006, respectively, from transactions
with other operating segments. The Beef segment had sales of
$142 million, $111 million and $104 million for fi scal years 2008, 2007
and 2006, respectively, from transactions with other operating seg-
ments. These sales from intersegment transactions, which are sold
at market prices, were excluded from the segment sales in the
above table.
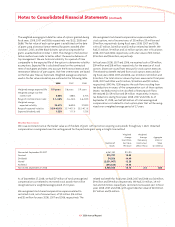
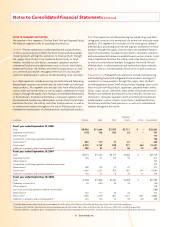
Our largest customer, Wal-Mart Stores, Inc., accounted for 13.3%,
13.4% and 13.0% of consolidated sales in fi scal years 2008, 2007 and
2006, respectively. Sales to Wal-Mart Stores, Inc. were included in
the Chicken, Beef, Pork and Prepared Foods segments. Any extended
discontinuance of sales to this customer could, if not replaced, have
a material impact on our operations.
The majority of our operations are domiciled in the United States.
Approximately 98% of sales to external customers for each of fi scal
years 2008, 2007 and 2006 were sourced from the United States.
Approximately $3.4 billion, $3.5 billion and $3.7 billion, respectively,
of property, plant and equipment were located in the United States
at September 27, 2008, September 29, 2007, and September 30, 2006.
Approximately $139 million, $125 million and $116 million of property,
plant and equipment were located in foreign countries, primarily
Mexico, at fi scal years ended 2008, 2007 and 2006, respectively.
We sell certain products in foreign markets, primarily Canada, Central
America, China, the European Union, Japan, Mexico, the Middle East,
Russia, South Korea, and Taiwan. Our export sales totaled $3.2 billion,
$2.5 billion and $2.0 billion for fi scal 2008, 2007 and 2006, respectively.
Substantially all of our export sales are facilitated through unaffi li-
ated brokers, marketing associations and foreign sales staffs. Foreign
sales, which are sales of products produced in a country other than
the United States, were less than 10% of consolidated sales for each
of fi scal years 2008, 2007 and 2006. Approximately 22% and 10% of
income from continuing operations before income taxes for fi scal 2008
and 2007, respectively, was from foreign operations. In fi scal 2006, we
had income from continuing operations before income taxes related
to foreign operations of $13 million.
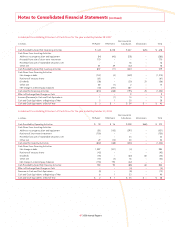
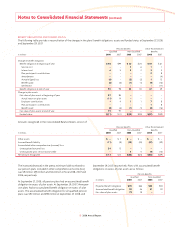
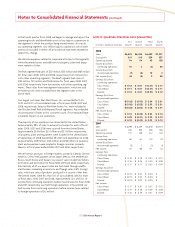
NOTE 19: QUARTERLY FINANCIAL DATA (UNAUDITED)
First Second Third Fourth
in millions, except per share data Quarter Quarter Quarter Quarter
2008
Sales $6,476 $6,336 $6,849 $7,201
Gross profi t 315 315 259 357
Operating income 94 54 45 138
Income (loss) from
continuing operations 41 3 (3) 45
Income (loss) from
discontinued operation (7) (8) 12 3
Net income (loss) 34 (5) 9 48
Earnings (loss) from
continuing operations:
Class A Basic $ 0.12 $ 0.01 $ (0.01) $ 0.13
Class B Basic $ 0.11 $ 0.01 $ (0.01) $ 0.11
Diluted $ 0.12 $ 0.01 $ (0.01) $ 0.12
Earnings (loss) from
discontinued operation:
Class A Basic $ (0.02) $ (0.03) $ 0.04 $ 0.01
Class B Basic $ (0.02) $ (0.02) $ 0.03 $ 0.01
Diluted $ (0.02) $ (0.03) $ 0.04 $ 0.01
Net income (loss):
Class A Basic $ 0.10 $ (0.02) $ 0.03 $ 0.14
Class B Basic $ 0.09 $ (0.01) $ 0.02 $ 0.12
Diluted $ 0.10 $ (0.02) $ 0.03 $ 0.13
2007
Sales $ 6,298 $ 6,239 $ 6,618 $ 6,574
Gross profi t 342 353 428 306
Operating income 151 148 212 102
Income from
continuing operations 60 61 114 33
Income (loss) from
discontinued operation (3) 7 (3) (1)
Net income 57 68 111 32
Earnings from
continuing operations:
Class A Basic $ 0.18 $ 0.18 $ 0.33 $ 0.10
Class B Basic $ 0.16 $ 0.16 $ 0.30 $ 0.08
Diluted $ 0.17 $ 0.17 $ 0.32 $ 0.09
Earnings (loss) from
discontinued operation:
Class A Basic $ (0.01) $ 0.02 $ (0.01) $ –
Class B Basic $ (0.01) $ 0.02 $ (0.01) $ –
Diluted $ (0.01) $ 0.02 $ (0.01) $ –
Net income:
Class A Basic $ 0.17 $ 0.20 $ 0.32 $ 0.10
Class B Basic $ 0.15 $ 0.18 $ 0.29 $ 0.08
Diluted $ 0.16 $ 0.19 $ 0.31 $ 0.09