Tyson Foods 2008 Annual Report Download - page 54
Download and view the complete annual report
Please find page 54 of the 2008 Tyson Foods annual report below. You can navigate through the pages in the report by either clicking on the pages listed below, or by using the keyword search tool below to find specific information within the annual report.-
 1
1 -
2
-
3
-
4
-
5
-
6
-
7
-
8
-
9
-
10
-
11
-
12
-
13
-
14
-
15
-
16
-
17
-
18
-
19
-
20
-
21
-
22
-
23
-
24
-
25
-
26
-
27
-
28
-
29
-
30
-
31
-
32
-
33
-
34
-
35
-
36
-
37
-
38
-
39
-
40
-
41
-
42
-
43
-
 44
44 -
 45
45 -
 46
46 -
 47
47 -
 48
48 -
 49
49 -
 50
50 -
 51
51 -
 52
52 -
 53
53 -
 54
54 -
 55
55 -
 56
56 -
 57
57 -
 58
58 -
 59
59 -
 60
60 -
 61
61 -
 62
62 -
 63
63 -
 64
64 -
65
-
66
-
67
-
68
-
69
-
70
-
71
-
72
 |
 |

52 Tyson Foods, Inc.
Notes to Consolidated Financial Statements (continued)
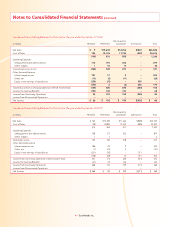
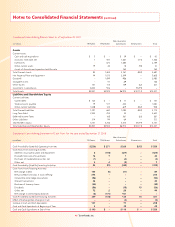
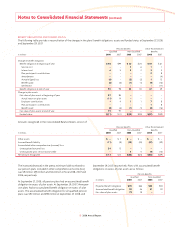
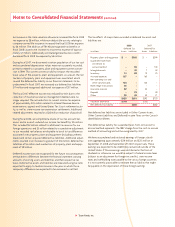
NET PERIODIC BENEFIT COST
Components of net periodic benefi t cost for pension and postretirement benefi t plans recognized in the Consolidated Statements of
Operations are as follows:
Pension Benefi ts Other Postretirement
Qualifi ed Non-Qualifi ed Benefi ts
in millions 2008 2007 2006 2008 2007 2006 2008 2007 2006
Service cost $ – $ – $ – $3 $6 $6 $ 1 $ 1 $ 1
Interest cost 6 5 5 2 2 1 3 4 4
Expected return on plan assets (7) (7) (6) – – – – – –
Amortization of prior service cost – – – 1 1 1 (1) (2) (2)
Recognized actuarial loss, net 1 1 – – – – 1 12 14
Curtailment and settlement gain – – – – – – – (27) (2)
Net periodic benefi t cost $ – $(1) $(1) $6 $9 $8 $ 4 $(12) $15
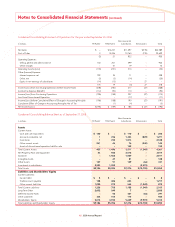
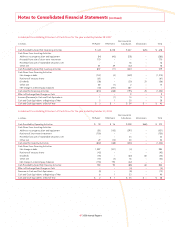
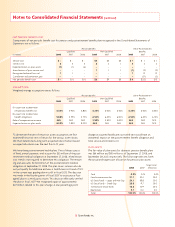
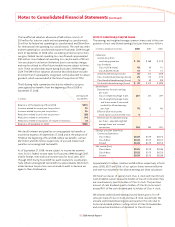
ASSUMPTIONS
Weighted average assumptions are as follows:
Pension Benefi ts Other Postretirement
Qualifi ed Non-Qualifi ed Benefi ts
2008 2007 2006 2008 2007 2006 2008 2007 2006
Discount rate to determine
net periodic benefi t cost 6.33% 5.93% 5.80% 6.25% 6.00% 6.00% 6.25% 6.00% 6.00%
Discount rate to determine
benefi t obligations 5.88% 5.39% 5.75% 6.50% 6.25% 6.00% 6.50% 6.25% 6.10%
Rate of compensation increase N/A N/A N/A 3.50% 3.50% 4.00% N/A N/A N/A
Expected return on plan assets 8.02% 7.89% 8.03% N/A N/A N/A N/A N/A N/A
To determine the rate-of-return on assets assumption, we fi rst
examined historical rates of return for the various asset classes.
We then determined a long-term projected rate-of-return based
on expected returns over the next fi ve to 10 years.
We have three postretirement health plans. Two of these consist
of fi xed, annual payments and account for $33 million of the post-
retirement medical obligation at September 27, 2008. A healthcare
cost trend is not required to determine this obligation. The remain-
ing plan accounts for $14 million of the postretirement medical
obligation at September 27, 2008. The plan covers retirees who do
not yet qualify for Medicare and uses a healthcare cost trend of 10%
in the current year, grading down to 6% in fi scal 2012. The decision
was made in the fourth quarter of fi scal 2007 to outsource a Post-
age 65 plan to a third party insurer. This decision effectively settled
the plan in fi scal 2007. We recognized a gain of approximately
$27 million related to this plan change. A one-percentage point
change in assumed healthcare cost trend rate would have an
immaterial impact on the postretirement benefi t obligation and
total service and interest cost.
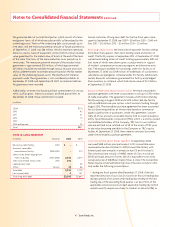
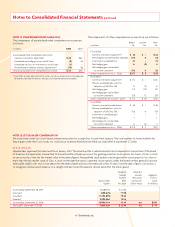
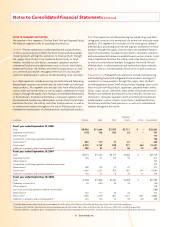
PLAN ASSETS
The fair value of plan assets for domestic pension benefi t plans
was $64 million and $80 million as of September 27, 2008, and
September 29, 2007, respectively. The following table sets forth
the actual and target asset allocation for pension plan assets:
Target Asset
2008 2007 Allocation
Cash 0.9% 2.2% 0.0%
Fixed income securities 31.1 24.4 30.0
US Stock Funds – Large- and Mid-Cap 24.1 48.8 25.0
US Stock Funds – Small-Cap 20.0 9.7 20.0
International Stock Funds 18.8 14.9 20.0
Real Estate 5.1 0.0 5.0
Total 100.0% 100.0% 100.0%