Tyson Foods 2008 Annual Report Download - page 46
Download and view the complete annual report
Please find page 46 of the 2008 Tyson Foods annual report below. You can navigate through the pages in the report by either clicking on the pages listed below, or by using the keyword search tool below to find specific information within the annual report.-
 1
1 -
2
-
3
-
4
-
5
-
6
-
7
-
8
-
9
-
10
-
11
-
12
-
13
-
14
-
15
-
16
-
17
-
18
-
19
-
20
-
21
-
22
-
23
-
24
-
25
-
26
-
27
-
28
-
29
-
30
-
31
-
32
-
33
-
34
-
35
-
 36
36 -
 37
37 -
 38
38 -
 39
39 -
 40
40 -
 41
41 -
 42
42 -
 43
43 -
 44
44 -
 45
45 -
 46
46 -
 47
47 -
 48
48 -
 49
49 -
 50
50 -
 51
51 -
 52
52 -
 53
53 -
 54
54 -
 55
55 -
 56
56 -
57
-
58
-
59
-
60
-
61
-
62
-
63
-
64
-
65
-
66
-
67
-
68
-
69
-
70
-
71
-
72
 |
 |

44 Tyson Foods, Inc.
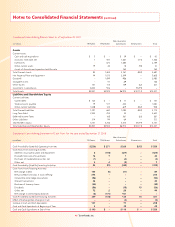
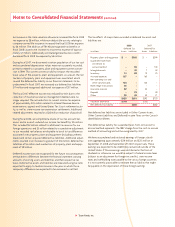
Notes to Consolidated Financial Statements (continued)
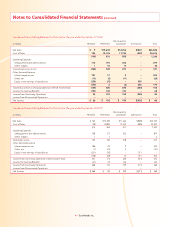
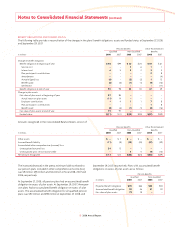
Condensed Consolidating Statement of Income for the year ended September 27, 2008
Non-Guarantor
in millions TFI Parent TFM Parent Subsidiaries Eliminations Total
Net Sales $ 9 $15,638 $12,052 $(837) $26,862
Cost of Sales 154 15,105 11,194 (837) 25,616
(145) 533 858 – 1,246
Operating Expenses:
Selling, general and administrative 118 193 568 – 879
Other charges 1 18 17 – 36
Operating Income (Loss) (264) 322 273 – 331
Other (Income) Expense:
Interest expense, net 181 17 8 – 206
Other, net (13) (5) (11) – (29)
Equity in net earnings of subsidiaries (325) (10) – 335 –
(157) 2 (3) 335 177
Income (Loss) from Continuing Operations before Income Taxes (107) 320 276 (335) 154
Income Tax Expense (Benefi t) (193) 138 123 – 68
Income from Continuing Operations 86 182 153 (335) 86
Income from Discontinued Operation – – – – –
Net Income $ 86 $ 182 $ 153 $(335) $ 86
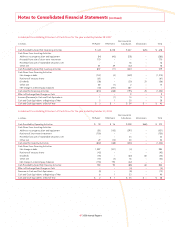
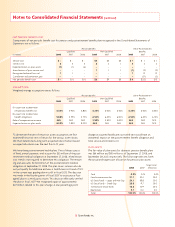
Condensed Consolidating Statement of Income for the year ended September 29, 2007
Non-Guarantor
in millions TFI Parent TFM Parent Subsidiaries Eliminations Total
Net Sales $ 165 $15,189 $11,264 $(889) $25,729
Cost of Sales (49) 14,885 10,353 (889) 24,300
214 304 911 – 1,429
Operating Expenses:
Selling, general and administrative 108 173 533 – 814
Other charges 1 1 – – 2
Operating Income 105 130 378 – 613
Other (Income) Expense:
Interest expense, net 186 29 9 – 224
Other, net (1) (24) 4 – (21)
Equity in net earnings of subsidiaries (321) (50) – 371 –
(136) (45) 13 371 203
Income from Continuing Operations before Income Taxes 241 175 365 (371) 410
Income Tax Expense (Benefi t) (27) 43 126 – 142
Income from Continuing Operations 268 132 239 (371) 268
Income from Discontinued Operation – – – – –
Net Income $ 268 $ 132 $ 239 $(371) $ 268