Tyson Foods 2008 Annual Report Download - page 19
Download and view the complete annual report
Please find page 19 of the 2008 Tyson Foods annual report below. You can navigate through the pages in the report by either clicking on the pages listed below, or by using the keyword search tool below to find specific information within the annual report.-
 1
1 -
2
-
3
-
4
-
5
-
6
-
7
-
8
-
 9
9 -
 10
10 -
 11
11 -
 12
12 -
 13
13 -
 14
14 -
 15
15 -
 16
16 -
 17
17 -
 18
18 -
 19
19 -
 20
20 -
 21
21 -
 22
22 -
 23
23 -
 24
24 -
 25
25 -
 26
26 -
 27
27 -
 28
28 -
 29
29 -
30
-
31
-
32
-
33
-
34
-
35
-
36
-
37
-
38
-
39
-
40
-
41
-
42
-
43
-
44
-
45
-
46
-
47
-
48
-
49
-
50
-
51
-
52
-
53
-
54
-
55
-
56
-
57
-
58
-
59
-
60
-
61
-
62
-
63
-
64
-
65
-
66
-
67
-
68
-
69
-
70
-
71
-
72
 |
 |

17 2008 Annual Report
Management’s Discussion and Analysis (continued)
2007 vs. 2006
• Sales and Operating Income – Sales and operating income increased
due to higher sales volume and increased average sales prices, due to
increased domestic demand and strong export markets. Additionally,
operating income was impacted positively by improved operating
cost effi ciencies and yield improvements, partially offset by higher
average live prices. Fiscal 2007 operating results included realized
and unrealized net gains of $3 million from our commodity risk man-
agement activities related to forward futures contracts for live hogs,
excluding the related impact from the physical sale and purchase
transactions, compared to realized and unrealized net losses of
$15 million recorded in fi scal 2006.
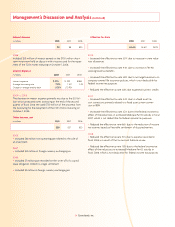
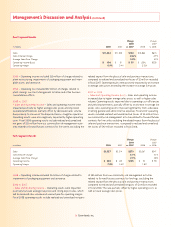
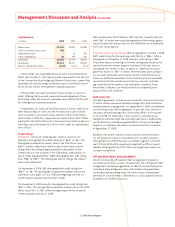
Prepared Foods Segment Results
Change Change
2008 2007
in millions 2008 2007 vs. 2007 2006 vs. 2006
Sales $2,711 $2,665 $ 46 $2,698 $ (33)
Sales Volume Change 1.5% (3.9)%
Average Sales Price Change 0.2% 2.8%
Operating Income $ 63 $ 92 $ (29) $ 55 $ 37
Operating Margin 2.3% 3.5% 2.0%
2008 – Operating income included $10 million of charges related to
fl ood damage, an intangible asset impairment and severance.
2007 – Operating income included $7 million of charges related to
intangible asset impairments.
2006 – Operating income included $19 million of charges related
to plant closings, other business consolidation efforts and our Cost
Management Initiative.
2008 vs. 2007
• Sales and Operating Income – Operating results were negatively
impacted by higher raw material costs, which include wheat, dairy and
cooking ingredient costs, partially offset by lower pork costs. Results
were positively impacted by an increase in average sales prices.
2007 vs. 2006
• Sales and Operating Income – Sales declined primarily due to
decreased sales volume, including reduced sales volume on lower
margin products, partially offset by increased average sales prices.
Operating income improved primarily due to an improvement in
average sales prices, partially offset by an increase in plant costs
and raw material costs.
LIQUIDITY AND CAPITAL RESOURCES
Our cash needs for working capital, capital expenditures and inter-
national growth are expected to be met with cash fl ows provided by
operating activities, anticipated proceeds from the Lakeside sale, or
short-term borrowings.
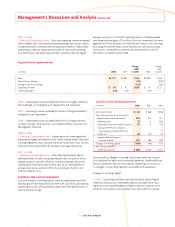
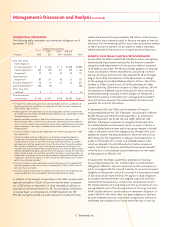
Cash Flows from Operating Activities
in millions 2008 2007 2006
Net income (loss) $ 86 $ 268 $(196)
Non-cash items in net income (loss):
Depreciation and amortization 493 514 517
Deferred taxes 35 5 (130)
Impairment and write-down of assets 57 14 18
Cumulative effect of change in
accounting principle, before tax – – 9
Other, net 26 (15) 30
Income before changes in
working capital 697 786 248
Changes in working capital (409) (108) 124
Net cash provided by
operating activities $ 288 $ 678 $ 372
Income before changes in working capital represents net income
(loss) adjusted for non-cash income and expenses. Additionally, this
amount represents net cash provided by operating activities prior
to changes in assets and liabilities associated with operations.
Changes in working capital:
• 2008 – Operating cash fl ows declined primarily due to higher
inventory and accounts receivable balances, partially offset by a
higher accounts payable balance. Higher inventory balances were
driven by an increase in raw material costs and inventory volume.