Tyson Foods 2008 Annual Report Download - page 51
Download and view the complete annual report
Please find page 51 of the 2008 Tyson Foods annual report below. You can navigate through the pages in the report by either clicking on the pages listed below, or by using the keyword search tool below to find specific information within the annual report.-
 1
1 -
2
-
3
-
4
-
5
-
6
-
7
-
8
-
9
-
10
-
11
-
12
-
13
-
14
-
15
-
16
-
17
-
18
-
19
-
20
-
21
-
22
-
23
-
24
-
25
-
26
-
27
-
28
-
29
-
30
-
31
-
32
-
33
-
34
-
35
-
36
-
37
-
38
-
39
-
40
-
 41
41 -
 42
42 -
 43
43 -
 44
44 -
 45
45 -
 46
46 -
 47
47 -
 48
48 -
 49
49 -
 50
50 -
 51
51 -
 52
52 -
 53
53 -
 54
54 -
 55
55 -
 56
56 -
 57
57 -
 58
58 -
 59
59 -
 60
60 -
 61
61 -
62
-
63
-
64
-
65
-
66
-
67
-
68
-
69
-
70
-
71
-
72
 |
 |

49 2008 Annual Report
Notes to Consolidated Financial Statements (continued)
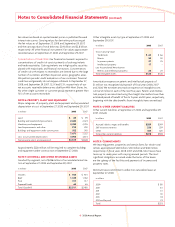
The weighted-average grant-date fair value of options granted during
fi scal years 2008, 2007 and 2006, respectively, was $5.22, $5.85 and
$6.86. The fair value of each option grant is established on the date
of grant using a binomial lattice method for grants awarded after
October 1, 2005, and the Black-Scholes option-pricing model for
grants awarded before October 1, 2005. The change to the binomial
lattice method was made to better refl ect the exercise behavior of
top management. We use historical volatility for a period of time
comparable to the expected life of the option to determine volatility
assumptions. Expected life is calculated based on the contractual
term of each grant and takes into account the historical exercise and
termination behavior of participants. Risk-free interest rates are based
on the fi ve-year Treasury bond rate. Weighted average assumptions
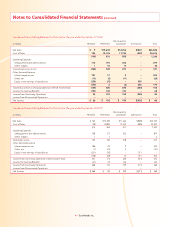
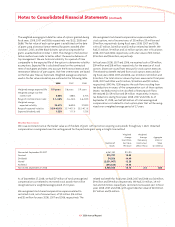
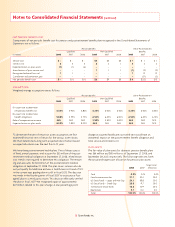
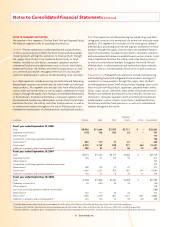
used in the fair value calculation are outlined in the following table.
2008 2007 2006
Weighted average expected life 5.5 years 5.6 years 5.9 years
Weighted average risk-free
interest rate 4.08% 3.88% 3.70%
Range of risk-free interest rates 3.1–4.6% 2.6–4.6% 2.6–4.8%
Weighted average
expected volatility 34.61% 36.85% 37.83%
Range of expected volatility 30.9–40.1% 33.7–40.1% 35.2–40.1%
Expected dividend yield 1.02% 1.11% 1.23%
We recognized stock-based compensation expense related to
stock options, net of income taxes, of $12 million, $11 million and
$9 million, respectively, during fi scal years 2008, 2007 and 2006,
with a $7 million, $6 million and $5 million related tax benefi t. We
had 2.5 million, 1.9 million and 3.3 million options vest in fi scal years
2008, 2007 and 2006, respectively, with a fair value of $15 million,
$9 million and $16 million, respectively.
In fi scal years 2008, 2007 and 2006, we received cash of $9 million,
$59 million and $28 million, respectively, for the exercise of stock
options. Shares are issued from treasury for stock option exercises.
The related tax benefi t realized from stock options exercised dur-
ing fi scal years 2008, 2007 and 2006, was $1 million, $12 million and
$4 million. The total intrinsic value of options exercised in fi scal years
2008, 2007 and 2006, was $3 million, $31 million and $10 million,
respectively. SFAS No. 123R requires the cash fl ows resulting from
tax deductions in excess of the compensation cost of those options
(excess tax deductions) to be classifi ed as fi nancing cash fl ows.
We realized $0, $9 million and $4 million, respectively, in excess
tax deductions during fi scal years 2008, 2007 and 2006. As of
September 27, 2008, we had $40 million of total unrecognized
compensation cost related to stock option plans that will be recog-
nized over a weighted average period of 2.7 years.
RESTRICTED STOCK
We issue restricted stock at the market value as of the date of grant, with restrictions expiring over periods through July 1, 2020. Unearned
compensation is recognized over the vesting period for the particular grant using a straight-line method.
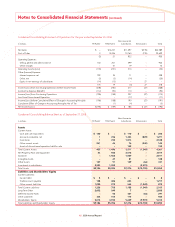
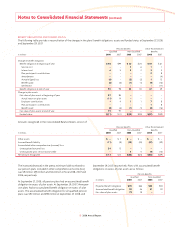
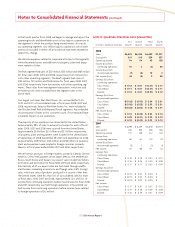
Weighted Weighted
Average Average Aggregate
Grant-Date Remaining Intrinsic
Number of Fair Value Contractual Value
Shares Per Share Life (in Years) (in millions)
Nonvested, September 29, 2007 6,061,334 $14.95
Granted 975,727 15.28
Dividends 54,206 14.49
Vested (2,031,907) 12.28
Forfeited (293,636) 15.54
Nonvested, September 27, 2008 4,765,724 16.16 2.4 $60
As of September 27, 2008, we had $37 million of total unrecognized
compensation cost related to restricted stock awards that will be
recognized over a weighted average period of 2.4 years.
We recognized stock-based compensation expense related to
restricted stock, net of income taxes, of $11 million, $14 million
and $15 million for years 2008, 2007 and 2006, respectively. The
related tax benefi t for fi scal years 2008, 2007 and 2006 was $6 million,
$9 million and $9 million, respectively. We had 2.0 million, 3.4 mil-
lion and 0.4 million, respectively, restricted stock awards vest in fi scal
years 2008, 2007 and 2006, with a grant date fair value of $24 million,
$37 million and $5 million.