Tyson Foods 2008 Annual Report Download - page 20
Download and view the complete annual report
Please find page 20 of the 2008 Tyson Foods annual report below. You can navigate through the pages in the report by either clicking on the pages listed below, or by using the keyword search tool below to find specific information within the annual report.-
 1
1 -
2
-
3
-
4
-
5
-
6
-
7
-
8
-
9
-
 10
10 -
 11
11 -
 12
12 -
 13
13 -
 14
14 -
 15
15 -
 16
16 -
 17
17 -
 18
18 -
 19
19 -
 20
20 -
 21
21 -
 22
22 -
 23
23 -
 24
24 -
 25
25 -
 26
26 -
 27
27 -
 28
28 -
 29
29 -
 30
30 -
31
-
32
-
33
-
34
-
35
-
36
-
37
-
38
-
39
-
40
-
41
-
42
-
43
-
44
-
45
-
46
-
47
-
48
-
49
-
50
-
51
-
52
-
53
-
54
-
55
-
56
-
57
-
58
-
59
-
60
-
61
-
62
-
63
-
64
-
65
-
66
-
67
-
68
-
69
-
70
-
71
-
72
 |
 |

18 Tyson Foods, Inc.
Management’s Discussion and Analysis (continued)
• 2007 – Operating cash fl ows declined primarily due to higher
inventory and accounts receivable balances, partially offset by a
higher accounts payable balance.
• 2006 – Operating cash fl ows increased primarily due to a lower
accounts receivable balance, higher accounts payable and interest
payable balances, partially offset by a lower income taxes payable/
receivable balance.
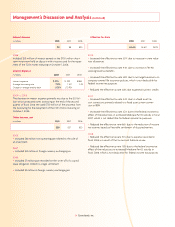
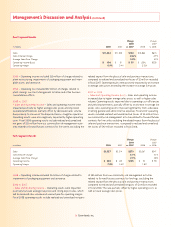
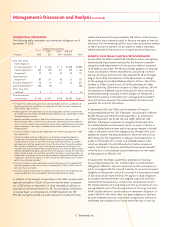
Cash Flows from Investing Activities
in millions 2008 2007 2006
Additions to property, plant
and equipment $(425) $(285) $ (531)
Proceeds from sale of property,
plant and equipment 26 76 21
Proceeds from sale (purchase) of
marketable securities, net (3) 16 23
Proceeds from sale (purchase) of
short-term investment – 770 (750)
Proceeds from sale of investments 22 – –
Other, net (19) 2 13
Net cash provided by (used for)
investing activities $(399) $ 579 $(1,224)
• Expenditures for property, plant and equipment include acquisition
of new equipment to upgrade our facilities to maintain competitive
standing and position us for future opportunities. In fi scal 2008, our
capital spending included equipment updates in our chicken plants,
as well as packaging equipment upgrades in our Fresh Meats case-
ready facilities. In fi scal 2007, we focused on reducing our capital
spending. In fi scal 2006, we had signifi cant capital investing, including
our new Discovery Center and the Sherman, Texas, case-ready facility.
• Capital spending for fi scal 2009 is expected to be $600 – $650 mil-
lion, which includes the following:
• approximately $425 – $450 million on current core business
capital spending;
• approximately $100 – $120 million on post-acquisition capital
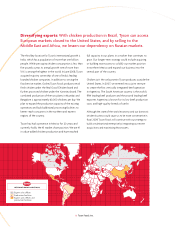
spending related to our Brazil and China acquisitions; and
• approximately $75 – $80 million related to Dynamic Fuels LLC’s
(Dynamic) facility. The cost to construct the facility is estimated
to be $138 million, which will be funded by $100 million of Gulf
Opportunity Zone tax-exempt bonds issued in October 2008,
along with equity contributions made by Tyson and Syntroleum
Corporation, most of which has already been made. Construc-
tion began in October 2008 and will continue through late 2009,
with production targeted for early 2010.
• Proceeds from sale of assets in fi scal 2007 include $40 million
received related to the sale of two poultry plants and related
support facilities.
• Short-term investment purchased in fi scal 2006 with proceeds from
$1.0 billion of senior notes maturing on April 1, 2016 (2016 Notes). The
short-term investment was held in an interest bearing account with a
trustee. In fi scal 2007, we used proceeds from sale of the short-term
investment to repay our outstanding $750 million 7.25% Notes due
October 1, 2006.
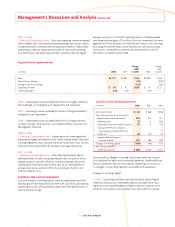
Cash Flows from Financing Activities
in millions 2008 2007 2006
Net borrowings (payments) on
revolving credit facilities $(213) $ 53 $ 158
Payments on debt (147) (1,263) (166)
Net proceeds from borrowings 449 – 992
Net proceeds from Class A
stock offering 274 – –
Convertible note hedge transactions (94) – –
Warrant transactions 44 – –
Purchases of treasury shares (30) (61) (42)
Dividends (56) (56) (55)
Stock options exercised 9 74 32
Increase (decrease) in negative
book cash balances 67 9 (85)
Other, net 18 (8) 10
Net cash provided by (used for)
fi nancing activities $ 321 $(1,252) $ 844
• Net borrowings (payments) on revolving credit facilities primarily
include activity related to the accounts receivable securitization
facility and commercial paper.
• Payments on debt include –
• In fi scal 2008, we bought back $40 million of our 2016 Notes and
repaid the remaining $25 million outstanding Lakeside term loan.