Tyson Foods 2008 Annual Report Download - page 32
Download and view the complete annual report
Please find page 32 of the 2008 Tyson Foods annual report below. You can navigate through the pages in the report by either clicking on the pages listed below, or by using the keyword search tool below to find specific information within the annual report.-
 1
1 -
2
-
3
-
4
-
5
-
6
-
7
-
8
-
9
-
10
-
11
-
12
-
13
-
14
-
15
-
16
-
17
-
18
-
19
-
20
-
21
-
 22
22 -
 23
23 -
 24
24 -
 25
25 -
 26
26 -
 27
27 -
 28
28 -
 29
29 -
 30
30 -
 31
31 -
 32
32 -
 33
33 -
 34
34 -
 35
35 -
 36
36 -
 37
37 -
 38
38 -
 39
39 -
 40
40 -
 41
41 -
 42
42 -
43
-
44
-
45
-
46
-
47
-
48
-
49
-
50
-
51
-
52
-
53
-
54
-
55
-
56
-
57
-
58
-
59
-
60
-
61
-
62
-
63
-
64
-
65
-
66
-
67
-
68
-
69
-
70
-
71
-
72
 |
 |

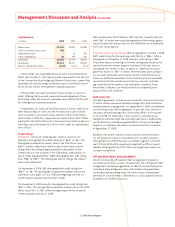
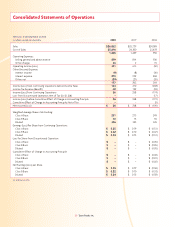
30 Tyson Foods, Inc.
Three years ended September 27, 2008
in millions, except per share data 2008 2007 2006
Sales $26,862 $25,729 $24,589
Cost of Sales 25,616 24,300 23,639
1,246 1,429 950
Operating Expenses:
Selling, general and administrative 879 814 930
Other charges 36 2 70
Operating Income (Loss) 331 613 (50)
Other (Income) Expense:
Interest income (9) (8) (30)
Interest expense 215 232 268
Other, net (29) (21) (20)
177 203 218
Income (Loss) from Continuing Operations before Income Taxes 154 410 (268)
Income Tax Expense (Benefi t) 68 142 (94)
Income (Loss) from Continuing Operations 86 268 (174)
Loss from Discontinued Operation, Net of Tax $0, $0, $(8) – – (17)
Income (Loss) before Cumulative Effect of Change in Accounting Principle 86 268 (191)
Cumulative Effect of Change in Accounting Principle, Net of Tax – – (5)
Net Income (Loss) $ 86 $ 268 $ (196)
Weighted Average Shares Outstanding:
Class A Basic 281 273 249
Class B Basic 70 75 96
Diluted 356 355 345
Earnings (Loss) Per Share from Continuing Operations:
Class A Basic $ 0.25 $ 0.79 $ (0.51)
Class B Basic $ 0.22 $ 0.70 $ (0.47)
Diluted $ 0.24 $ 0.75 $ (0.51)
Loss Per Share from Discontinued Operation:
Class A Basic $ – $ – $ (0.05)
Class B Basic $ – $ – $ (0.05)
Diluted $ – $ – $ (0.05)
Cumulative Effect of Change in Accounting Principle
Class A Basic $ – $ – $ (0.02)
Class B Basic $ – $ – $ (0.01)
Diluted $ – $ – $ (0.02)
Net Earnings (Loss) per Share
Class A Basic $ 0.25 $ 0.79 $ (0.58)
Class B Basic $ 0.22 $ 0.70 $ (0.53)
Diluted $ 0.24 $ 0.75 $ (0.58)
See accompanying notes.
Consolidated Statements of Operations