Tyson Foods 2008 Annual Report Download - page 16
Download and view the complete annual report
Please find page 16 of the 2008 Tyson Foods annual report below. You can navigate through the pages in the report by either clicking on the pages listed below, or by using the keyword search tool below to find specific information within the annual report.-
 1
1 -
2
-
3
-
4
-
5
-
 6
6 -
 7
7 -
 8
8 -
 9
9 -
 10
10 -
 11
11 -
 12
12 -
 13
13 -
 14
14 -
 15
15 -
 16
16 -
 17
17 -
 18
18 -
 19
19 -
 20
20 -
 21
21 -
 22
22 -
 23
23 -
 24
24 -
 25
25 -
 26
26 -
27
-
28
-
29
-
30
-
31
-
32
-
33
-
34
-
35
-
36
-
37
-
38
-
39
-
40
-
41
-
42
-
43
-
44
-
45
-
46
-
47
-
48
-
49
-
50
-
51
-
52
-
53
-
54
-
55
-
56
-
57
-
58
-
59
-
60
-
61
-
62
-
63
-
64
-
65
-
66
-
67
-
68
-
69
-
70
-
71
-
72
 |
 |

14 Tyson Foods, Inc.
Management’s Discussion and Analysis (continued)
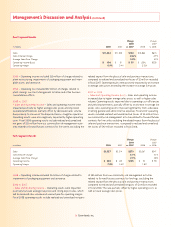
Interest Income
in millions 2008 2007 2006
$9 $8 $30
2006
Included $20 million of interest earned on the $750 million short-
term investment held on deposit with a trustee used for the repay-
ment of the 7.25% Notes maturing on October 1, 2006.
Interest Expense
in millions 2008 2007 2006
Interest expense $ 215 $ 232 $268
Average borrowing rate 7.0% 7.4% 7.4%
Change in average weekly debt (1.7)% (15.9)%
2007 vs. 2006
The decrease in interest expense primarily was due to the $1.0 bil-
lion senior unsecured notes borrowing at the end of the second
quarter of fi scal 2006. We used $750 million of the proceeds from
the borrowing for the repayment of the 7.25% Notes maturing on
October 1, 2006.
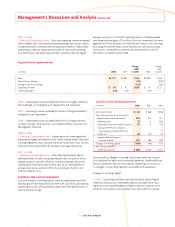
Other Income, net
in millions 2008 2007 2006
$29 $21 $20
2008
• Included $18 million non-operating gain related to the sale of
an investment.
2007
• Included $14 million in foreign currency exchange gain.
2006
• Included $7 million gain recorded on the write-off of a capital
lease obligation related to a legal settlement.
• Included $5 million in foreign currency exchange gain.
Effective Tax Rate
2008 2007 2006
44.6% 34.6% 35.0%
2008
• Increased the effective tax rate 5.0% due to increase in state valua-
tion allowances.
• Increased the effective tax rate 4.4% due to increase in FIN 48
unrecognized tax benefi ts.
• Increased the effective tax rate 3.8% due to net negative returns on
company-owned life insurance policies, which is not deductible for
federal income tax purposes.
• Reduced the effective tax rate 3.8% due to general business credits.
2007
• Increased the effective tax rate 4.2% due to a fi xed asset tax
cost correction, primarily related to a fi xed asset system conver-
sion in 1999.
• Increased the effective tax rate 3.2% due to the federal income tax
effect of the reductions in estimated Medicare Part D subsidy in fi scal
2007, which is not deductible for federal income tax purposes.
• Reduced the effective tax rate 4.6% due to the reduction of income
tax reserves based on favorable settlement of disputed matters.
2006
• Reduced the effective tax rate 5.1% due to expense recorded in
fi scal 2006 as a result of the tax account balance review.
• Reduced the effective tax rate 1.8% due to the federal income tax
effect of the reductions in estimated Medicare Part D subsidy in
fi scal 2006, which is not deductible for federal income tax purposes.