Tyson Foods 2008 Annual Report Download - page 48
Download and view the complete annual report
Please find page 48 of the 2008 Tyson Foods annual report below. You can navigate through the pages in the report by either clicking on the pages listed below, or by using the keyword search tool below to find specific information within the annual report.-
 1
1 -
2
-
3
-
4
-
5
-
6
-
7
-
8
-
9
-
10
-
11
-
12
-
13
-
14
-
15
-
16
-
17
-
18
-
19
-
20
-
21
-
22
-
23
-
24
-
25
-
26
-
27
-
28
-
29
-
30
-
31
-
32
-
33
-
34
-
35
-
36
-
37
-
 38
38 -
 39
39 -
 40
40 -
 41
41 -
 42
42 -
 43
43 -
 44
44 -
 45
45 -
 46
46 -
 47
47 -
 48
48 -
 49
49 -
 50
50 -
 51
51 -
 52
52 -
 53
53 -
 54
54 -
 55
55 -
 56
56 -
 57
57 -
 58
58 -
59
-
60
-
61
-
62
-
63
-
64
-
65
-
66
-
67
-
68
-
69
-
70
-
71
-
72
 |
 |

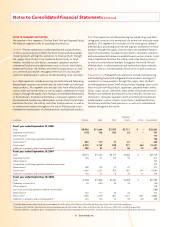
46 Tyson Foods, Inc.
Notes to Consolidated Financial Statements (continued)
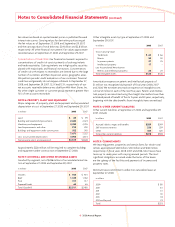
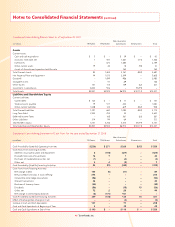
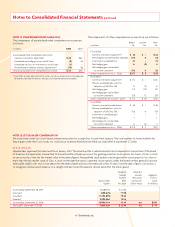
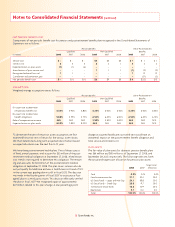
Condensed Consolidating Balance Sheet as of September 29, 2007
Non-Guarantor
in millions TFI Parent TFM Parent Subsidiaries Eliminations Total
Assets
Current Assets:
Cash and cash equivalents $ 3 $ – $ 39 $ – $ 42
Accounts receivable, net 1 557 1,461 (773) 1,246
Inventories – 674 1,485 – 2,159
Other current assets 79 32 18 (59) 70
Assets of discontinued operation held for sale – – 164 – 164
Total Current Assets 83 1,263 3,167 (832) 3,681
Net Property, Plant and Equipment 44 1,015 2,549 – 3,608
Goodwill – 1,499 986 – 2,485
Intangible Assets – 57 69 – 126
Other Assets 137 113 139 (62) 327
Investment in subsidiaries 8,243 976 – (9,219) –
Total Assets $8,507 $4,923 $6,910 $(10,113) $10,227
Liabilities and Shareholders’ Equity
Current Liabilities:
Current debt $ 120 $ – $ 17 $ – $ 137
Trade accounts payable 79 517 454 – 1,050
Other current liabilities 1,008 143 609 (832) 928
Total Current Liabilities 1,207 660 1,080 (832) 2,115
Long-Term Debt 2,355 255 32 – 2,642
Deferred Income Taxes – 168 261 (62) 367
Other Liabilities 214 94 64 – 372
Shareholders’ Equity 4,731 3,746 5,473 (9,219) 4,731
Total Liabilities and Shareholders’ Equity $8,507 $4,923 $6,910 $(10,113) $10,227
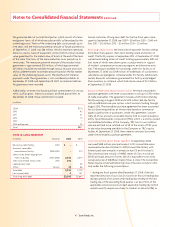
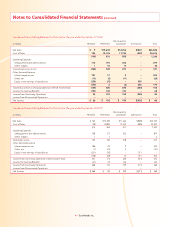
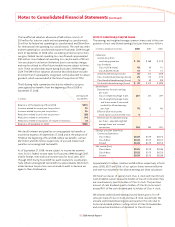
Condensed Consolidating Statement of Cash Flows for the year ended September 27, 2008
Non-Guarantor
in millions TFI Parent TFM Parent Subsidiaries Eliminations Total
Cash Provided by (Used for) Operating Activities $(236) $ 271 $ 268 $(15) $ 288
Cash Flows From Investing Activities:
Additions to property, plant and equipment 6 (104) (327) – (425)
Proceeds from sale of investments 14 7 1 – 22
Purchases of marketable securities, net (1) – (2) – (3)
Other, net 5 4 (2) – 7
Cash Provided by (Used for) Investing Activities 24 (93) (330) – (399)
Cash Flows From Financing Activities:
Net change in debt 145 (5) (51) – 89
Net proceeds from Class A stock offering 274 – – – 274
Convertible note hedge transactions (94) – – – (94)
Warrant transactions 44 – – – 44
Purchase of treasury shares (30) – – – (30)
Dividends (56) – (15) 15 (56)
Other, net 72 2 20 – 94
Net change in intercompany balances (6) (175) 181 – –
Cash Provided by (Used for) Financing Activities 349 (178) 135 15 321
Effect of Exchange Rate Change on Cash – – (2) – (2)
Increase in Cash and Cash Equivalents 137 – 71 – 208
Cash and Cash Equivalents at Beginning of Year 3 – 39 – 42
Cash and Cash Equivalents at End of Year $ 140 $ – $ 110 $ – $ 250