Tyson Foods 2008 Annual Report Download - page 34
Download and view the complete annual report
Please find page 34 of the 2008 Tyson Foods annual report below. You can navigate through the pages in the report by either clicking on the pages listed below, or by using the keyword search tool below to find specific information within the annual report.-
 1
1 -
2
-
3
-
4
-
5
-
6
-
7
-
8
-
9
-
10
-
11
-
12
-
13
-
14
-
15
-
16
-
17
-
18
-
19
-
20
-
21
-
22
-
23
-
 24
24 -
 25
25 -
 26
26 -
 27
27 -
 28
28 -
 29
29 -
 30
30 -
 31
31 -
 32
32 -
 33
33 -
 34
34 -
 35
35 -
 36
36 -
 37
37 -
 38
38 -
 39
39 -
 40
40 -
 41
41 -
 42
42 -
 43
43 -
 44
44 -
45
-
46
-
47
-
48
-
49
-
50
-
51
-
52
-
53
-
54
-
55
-
56
-
57
-
58
-
59
-
60
-
61
-
62
-
63
-
64
-
65
-
66
-
67
-
68
-
69
-
70
-
71
-
72
 |
 |

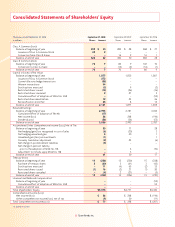
32 Tyson Foods, Inc.
Consolidated Statements of Shareholders’ Equity
Three years ended September 27, 2008 September 27, 2008 September 29, 2007 September 30, 2006
in millions Shares Amount Shares Amount Shares Amount
Class A Common Stock:
Balance at beginning of year 300 $ 30 284 $ 28 268 $ 27
Issuance of Class A Common Stock 22 2 – – – –
Conversion from Class B shares – – 16 2 16 1
Balance at end of year 322 32 300 30 284 28
Class B Common Stock:
Balance at beginning of year 70 7 86 9 102 10
Conversion to Class A shares – – (16) (2) (16) (1)
Balance at end of year 70 7 70 7 86 9
Capital in Excess of Par Value:
Balance at beginning of year 1,877 1,835 1,867
Issuance of Class A Common Stock 272 – –
Convertible note hedge transactions (58) – –
Warrant transactions 44 – –
Stock options exercised (5) 9 (2)
Restricted shares issued (14) (26) (16)
Restricted shares canceled 2 27 3
Cumulative effect of adoption of SFAS No. 123R – – (55)
Restricted share amortization 19 24 26
Reclassifi cation and other 24 8 12
Balance at end of year 2,161 1,877 1,835
Retained Earnings:
Balance at beginning of year 2,993 2,781 3,032
Cumulative effect of adoption of FIN 48 (17) – –
Net income (loss) 86 268 (196)
Dividends paid (56) (56) (55)
Balance at end of year 3,006 2,993 2,781
Accumulated Other Comprehensive Income (Loss), Net of Tax:
Balance at beginning of year 50 17 28
Net hedging (gain) loss recognized in cost of sales (6) (20) 3
Net hedging unrealized gain 4 20 1
Unrealized gain (loss) on investments (1) – 1
Currency translation adjustment (2) 24 (6)
Net change in postretirement liabilities (4) – –
Net change in pension liability,
prior to the adoption of SFAS No. 158 – 6 (10)
Adjustment to initially apply SFAS No. 158 – 3 –
Balance at end of year 41 50 17
Treasury Stock:
Balance at beginning of year 14 (226) 15 (230) 15 (238)
Purchase of treasury shares 2 (30) 3 (61) 3 (42)
Stock options exercised – 11 (4) 65 (2) 35
Restricted shares issued (1) 16 (2) 27 (1) 20
Restricted shares canceled – (4) 2 (27) – (5)
Balance at end of year 15 (233) 14 (226) 15 (230)
Unamortized Deferred Compensation:
Balance at beginning of year – – (55)
Cumulative effect of adoption of SFAS No. 123R – – 55
Balance at end of year – – –
Total Shareholders’ Equity $5,014 $4,731 $4,440
Comprehensive Income (Loss):
Net income (loss) $ 86 $ 268 $ (196)
Other comprehensive income (loss), net of tax (9) 30 (11)
Total Comprehensive Income (Loss) $ 77 $ 298 $ (207)
See accompanying notes.