Tyson Foods 2008 Annual Report Download - page 17
Download and view the complete annual report
Please find page 17 of the 2008 Tyson Foods annual report below. You can navigate through the pages in the report by either clicking on the pages listed below, or by using the keyword search tool below to find specific information within the annual report.-
 1
1 -
2
-
3
-
4
-
5
-
6
-
 7
7 -
 8
8 -
 9
9 -
 10
10 -
 11
11 -
 12
12 -
 13
13 -
 14
14 -
 15
15 -
 16
16 -
 17
17 -
 18
18 -
 19
19 -
 20
20 -
 21
21 -
 22
22 -
 23
23 -
 24
24 -
 25
25 -
 26
26 -
 27
27 -
28
-
29
-
30
-
31
-
32
-
33
-
34
-
35
-
36
-
37
-
38
-
39
-
40
-
41
-
42
-
43
-
44
-
45
-
46
-
47
-
48
-
49
-
50
-
51
-
52
-
53
-
54
-
55
-
56
-
57
-
58
-
59
-
60
-
61
-
62
-
63
-
64
-
65
-
66
-
67
-
68
-
69
-
70
-
71
-
72
 |
 |

15 2008 Annual Report
Management’s Discussion and Analysis (continued)
SEGMENT RESULTS
We operate in four segments: Chicken, Beef, Pork and Prepared Foods.
The following table is a summary of sales and operating income
(loss), which is how we measure segment income (loss).
In the fourth quarter fi scal 2008, we began to manage and report the
operating results and identifi able assets of our logistics operations in
the segment in which the product being moved relates. As a result,
our operating segments now refl ect logistics operations which were
previously included in Other. All prior periods have been restated to
refl ect this change.
Segment results exclude the results of our discontinued operation,
Lakeside.
Sales Operating Income (Loss)
in millions 2008 2007 2006 2008 2007 2006
Chicken $ 8,900 $ 8,210 $ 7,958 $(118) $325 $ 94
Beef 11,664 11,540 10,866 106 51 (254)
Pork 3,587 3,314 3,067 280 145 55
Prepared Foods 2,711 2,665 2,698 63 92 55
Total $26,862 $25,729 $24,589 $ 331 $613 $ (50)
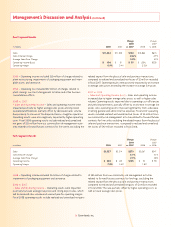
Chicken Segment Results
Change Change
2008 2007
in millions 2008 2007 vs. 2007 2006 vs. 2006
Sales $8,900 $8,210 $ 690 $7,958 $252
Sales Volume Change (0.4)% (4.7)%
Average Sales Price Change 8.9% 8.3%
Operating Income (Loss) $ (118) $ 325 $(443) $ 94 $231
Operating Margin (1.3)% 4.0% 1.2%
2008 – Operating loss included $26 million of charges related to:
plant closings; impairments of unimproved real property and soft-
ware; and severance.
2007 – Operating income included a $10 million gain on the sale of
two poultry plants and related support facilities.
2006 – Operating income included $9 million of charges related to
our Cost Management Initiative, other business consolidation efforts
and plant closing costs.
2008 vs. 2007
• Sales and Operating Income (Loss) – Sales increased as a result of
an increase in average sales prices, partially offset by a decrease in
sales volume due to the sale of two poultry plants in fi scal 2007.
Operating results were adversely impacted by increased input costs
of approximately $900 million, including grain costs, other feed
ingredient costs and cooking ingredients. Plant costs, including labor
and logistics, increased by approximately $200 million. This was
partially offset by increased net gains of $127 million from our
commodity trading risk management activities related to grain
purchases, which exclude the impact from related physical pur-
chase transactions that will impact future period operating results.
Operating results were also negatively impacted by increased selling,
general and administrative expenses of $43 million.
2007 vs. 2006
• Sales and Operating Income – Sales and operating income increased
due to an increase in average sales prices, partially offset by a decrease
in sales volume. The decrease in sales volume was due to planned
production cuts, the sale of two poultry plants and the closure of a
poultry plant in fi scal 2006 due to a fi re. The increase in average sales
prices contributed to improved operating income, partially offset
by an increase in net grain costs of $256 million. The increase of net
grain costs includes $334 million of increased grain costs, partially
offset by increased net gains of $78 million from our commodity
risk management activities related to grain purchases. Additionally,
operating income improved due to a decrease in selling, general and
administrative expenses.