Tyson Foods 2008 Annual Report Download - page 57
Download and view the complete annual report
Please find page 57 of the 2008 Tyson Foods annual report below. You can navigate through the pages in the report by either clicking on the pages listed below, or by using the keyword search tool below to find specific information within the annual report.-
 1
1 -
2
-
3
-
4
-
5
-
6
-
7
-
8
-
9
-
10
-
11
-
12
-
13
-
14
-
15
-
16
-
17
-
18
-
19
-
20
-
21
-
22
-
23
-
24
-
25
-
26
-
27
-
28
-
29
-
30
-
31
-
32
-
33
-
34
-
35
-
36
-
37
-
38
-
39
-
40
-
41
-
42
-
43
-
44
-
45
-
46
-
 47
47 -
 48
48 -
 49
49 -
 50
50 -
 51
51 -
 52
52 -
 53
53 -
 54
54 -
 55
55 -
 56
56 -
 57
57 -
 58
58 -
 59
59 -
 60
60 -
 61
61 -
 62
62 -
 63
63 -
 64
64 -
 65
65 -
 66
66 -
 67
67 -
68
-
69
-
70
-
71
-
72
 |
 |

55 2008 Annual Report
Notes to Consolidated Financial Statements (continued)
The tax effected valuation allowance of $49 million consists of
$30 million for state tax credit and net operating loss carryforwards,
$3 million for federal net operating loss carryforwards and $16 million
for international net operating loss carryforwards. The state tax credit
and net operating loss carryforwards expire in fi scal years 2009 through
2027. At September 27, 2008, after considering utilization restrictions,
our gross federal tax net operating loss carryforwards approximated
$165 million. Gross federal net operating loss carryforwards of $8 mil-
lion are subject to utilization limitations due to ownership changes
and may be utilized to offset future taxable income subject to limita-
tions. These carryforwards expire during fi scal years 2009 through
2024. The $49 million valuation allowance described above includes
$3 million that if subsequently recognized, will be allocated to reduce
goodwill, which was recorded at the time of acquisition of TFM.
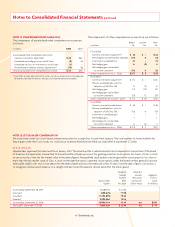
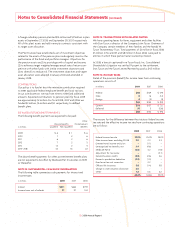
The following table summarizes the activity related to our gross
unrecognized tax benefi ts from the beginning of fi scal 2008 to
September 27, 2008.
Unrecognized
in millions Tax Benefi ts
Balance as of the beginning of fi scal 2008 $210
Increases related to current year tax positions 23
Increases related to prior year tax positions 36
Reductions related to prior year tax positions (28)
Reductions related to settlements (14)
Reductions related to expirations of statute of limitations (7)
Balance as of September 27, 2008 $220
We classify interest and penalties on unrecognized tax benefi ts as
income tax expense. At September 27, 2008, and at the adoption of
FIN 48 at the beginning of fi scal 2008, before tax benefi ts, we had
$67 million and $70 million, respectively, of accrued interest and
penalties on unrecognized tax benefi ts.
As of September 27, 2008, we are subject to income tax examina-
tions for U.S. federal income taxes for fi scal years 1998 through 2007,
and for foreign, state and local income taxes for fi scal years 2001
through 2007. During fi scal 2009, tax audit resolutions could poten-
tially reduce unrecognized tax benefi ts by approximately $26 million,
either because tax positions are sustained on audit or because we
agree to their disallowance.
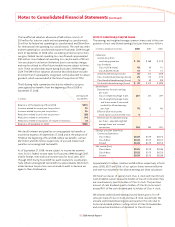
NOTE 17: EARNINGS (LOSS) PER SHARE
The earnings and weighted average common shares used in the com-
putation of basic and diluted earnings (loss) per share are as follows:
in millions, except per share data 2008 2007 2006
Numerator:
Income (loss) from
continuing operations $ 86 $ 268 $ (174)
Less Dividends:
Class A ($0.16/share) 46 45 41
Class B ($0.144/share) 10 11 14
Undistributed earnings (losses) 30 212 (229)
Class A undistributed earnings (losses) 25 170 (170)
Class B undistributed earnings (losses) 5 42 (59)
Total undistributed earnings (losses) $ 30 $ 212 $ (229)
Denominator:
Denominator for basic earnings
per share:
Class A weighted average shares 281 273 249
Class B weighted average shares,
and shares under if-converted
method for diluted earnings
per share 70 75 96
Effect of dilutive securities:
Stock options and restricted stock 5 7 –
Denominator for diluted earnings
per share – adjusted weighted
average shares and assumed
conversions 356 355 345
Earnings (Loss) Per Share from
Continuing Operations:
Class A Basic $0.25 $0.79 $(0.51)
Class B Basic $0.22 $0.70 $(0.47)
Diluted $0.24 $0.75 $(0.51)
Net income (loss):
Class A Basic $0.25 $0.79 $(0.58)
Class B Basic $0.22 $0.70 $(0.53)
Diluted $0.24 $0.75 $(0.58)
Approximately 10 million, 4 million and 28 million, respectively, in fi scal
years 2008, 2007 and 2006, of our option shares were antidilutive
and were not included in the dilutive earnings per share calculation.
We have two classes of capital stock, Class A stock and Class B stock.
Cash dividends cannot be paid to holders of Class B stock unless they
are simultaneously paid to holders of Class A stock. The per share
amount of cash dividends paid to holders of Class B stock cannot
exceed 90% of the cash dividend paid to holders of Class A stock.
We allocate undistributed earnings (losses) based upon a 1 to 0.9
ratio per share of Class A stock and Class B stock, respectively. We
allocate undistributed earnings (losses) based on this ratio due to
historical dividend patterns, voting control of Class B shareholders
and contractual limitations of dividends to Class B stock.