Tyson Foods 2008 Annual Report Download - page 47
Download and view the complete annual report
Please find page 47 of the 2008 Tyson Foods annual report below. You can navigate through the pages in the report by either clicking on the pages listed below, or by using the keyword search tool below to find specific information within the annual report.-
 1
1 -
2
-
3
-
4
-
5
-
6
-
7
-
8
-
9
-
10
-
11
-
12
-
13
-
14
-
15
-
16
-
17
-
18
-
19
-
20
-
21
-
22
-
23
-
24
-
25
-
26
-
27
-
28
-
29
-
30
-
31
-
32
-
33
-
34
-
35
-
36
-
 37
37 -
 38
38 -
 39
39 -
 40
40 -
 41
41 -
 42
42 -
 43
43 -
 44
44 -
 45
45 -
 46
46 -
 47
47 -
 48
48 -
 49
49 -
 50
50 -
 51
51 -
 52
52 -
 53
53 -
 54
54 -
 55
55 -
 56
56 -
 57
57 -
58
-
59
-
60
-
61
-
62
-
63
-
64
-
65
-
66
-
67
-
68
-
69
-
70
-
71
-
72
 |
 |

45 2008 Annual Report
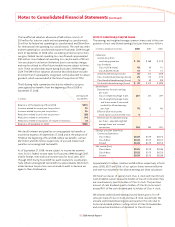
Notes to Consolidated Financial Statements (continued)
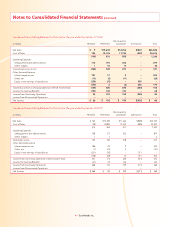
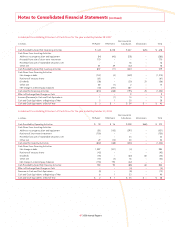
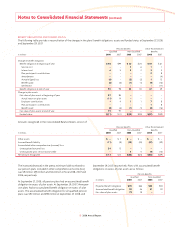
Condensed Consolidating Statement of Operations for the year ended September 30, 2006
Non-Guarantor
in millions TFI Parent TFM Parent Subsidiaries Eliminations Total
Net Sales $ – $14,227 $11,097 $(735) $24,589
Cost of Sales 3 14,206 10,165 (735) 23,639
(3) 21 932 – 950
Operating Expenses:
Selling, general and administrative 130 201 599 – 930
Other charges – 51 19 – 70
Operating Income (Loss) (133) (231) 314 – (50)
Other (Income) Expense:
Interest expense, net 192 35 11 – 238
Other, net (3) (3) (14) – (20)
Equity in net earnings of subsidiaries (14) (13) – 27 –
175 19 (3) 27 218
Income (Loss) from Continuing Operations before Income Taxes (308) (250) 317 (27) (268)
Income Tax Expense (Benefi t) (112) (92) 110 – (94)
Income (Loss) from Continuing Operations (196) (158) 207 (27) (174)
Loss from Discontinued Operation – – (17) – (17)
Income (Loss) before Cumulative Effect of Change in Accounting Principle (196) (158) 190 (27) (191)
Cumulative Effect of Change in Accounting Principle, Net of Tax – (1) (4) – (5)
Net Income (Loss) $(196) $ (159) $ 186 $ (27) $ (196)
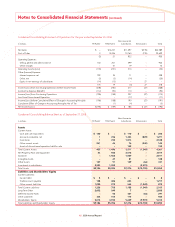
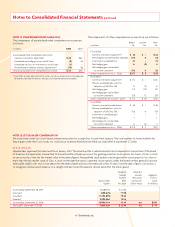
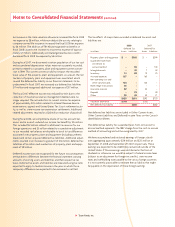
Condensed Consolidating Balance Sheet as of September 27, 2008
Non-Guarantor
in millions TFI Parent TFM Parent Subsidiaries Eliminations Total
Assets
Current Assets:
Cash and cash equivalents $ 140 $ – $ 110 $ – $ 250
Accounts receivable, net 1 726 1,353 (809) 1,271
Inventories 1 724 1,813 – 2,538
Other current assets 261 46 76 (240) 143
Assets of discontinued operation held for sale – – 159 – 159
Total Current Assets 403 1,496 3,511 (1,049) 4,361
Net Property, Plant and Equipment 43 960 2,516 – 3,519
Goodwill – 1,502 1,009 – 2,511
Intangible Assets – 47 81 – 128
Other Assets 147 91 159 (66) 331
Investment in subsidiaries 8,593 1,000 – (9,593) –
Total Assets $9,186 $5,096 $7,276 $(10,708) $10,850
Liabilities and Shareholders’ Equity
Current Liabilities:
Current debt $ 8 $ – $ – $ – $ 8
Trade accounts payable 108 486 623 – 1,217
Other current liabilities 1,090 272 565 (1,049) 878
Total Current Liabilities 1,206 758 1,188 (1,049) 2,103
Long-Term Debt 2,632 249 7 – 2,888
Deferred Income Taxes – 50 307 (66) 291
Other Liabilities 334 105 115 – 554
Shareholders’ Equity 5,014 3,934 5,659 (9,593) 5,014
Total Liabilities and Shareholders’ Equity $9,186 $5,096 $7,276 $(10,708) $10,850