Tyson Foods 2008 Annual Report Download - page 58
Download and view the complete annual report
Please find page 58 of the 2008 Tyson Foods annual report below. You can navigate through the pages in the report by either clicking on the pages listed below, or by using the keyword search tool below to find specific information within the annual report.-
 1
1 -
2
-
3
-
4
-
5
-
6
-
7
-
8
-
9
-
10
-
11
-
12
-
13
-
14
-
15
-
16
-
17
-
18
-
19
-
20
-
21
-
22
-
23
-
24
-
25
-
26
-
27
-
28
-
29
-
30
-
31
-
32
-
33
-
34
-
35
-
36
-
37
-
38
-
39
-
40
-
41
-
42
-
43
-
44
-
45
-
46
-
47
-
 48
48 -
 49
49 -
 50
50 -
 51
51 -
 52
52 -
 53
53 -
 54
54 -
 55
55 -
 56
56 -
 57
57 -
 58
58 -
 59
59 -
 60
60 -
 61
61 -
 62
62 -
 63
63 -
 64
64 -
 65
65 -
 66
66 -
 67
67 -
 68
68 -
69
-
70
-
71
-
72
 |
 |

56 Tyson Foods, Inc.
Notes to Consolidated Financial Statements (continued)
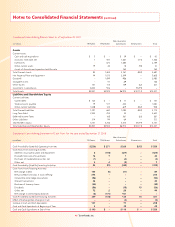
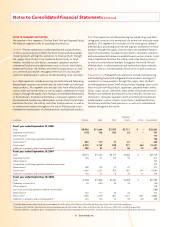
NOTE 18: SEGMENT REPORTING
We operate in four segments: Chicken, Beef, Pork and Prepared Foods.
We measure segment profi t as operating income (loss).
Chicken: Chicken operations include breeding and raising chickens,
as well as processing live chickens into fresh, frozen and value-added
chicken products and logistics operations to move products through
the supply chain. Products are marketed domestically to food
retailers, foodservice distributors, restaurant operators and non-
commercial foodservice establishments such as schools, hotel chains,
healthcare facilities, the military and other food processors, as well
as to international markets throughout the world. It also includes
sales from allied products and our chicken breeding stock subsidiary.
Beef: Beef operations include processing live fed cattle and fabricating
dressed beef carcasses into primal and sub-primal meat cuts and case-
ready products. This segment also includes sales from allied products
such as hides and variety meats, as well as logistics operations to move
products through the supply chain. Products are marketed domestically
to food retailers, foodservice distributors, restaurant operators and
noncommercial foodservice establishments such as schools, hotel chains,
healthcare facilities, the military and other food processors, as well as
to international markets throughout the world. Allied products are
marketed to manufacturers of pharmaceuticals and technical products.
Pork: Pork operations include processing live market hogs and fabri-
cating pork carcasses into primal and sub-primal cuts and case-ready
products. This segment also includes our live swine group, related
allied product processing activities and logistics operations to move
products through the supply chain. Products are marketed domesti-
cally to food retailers, foodservice distributors, restaurant operators
and noncommercial foodservice establishments such as schools, hotel
chains, healthcare facilities, the military and other food processors,
as well as to international markets throughout the world. We sell
allied products to pharmaceutical and technical products manufac-
turers, as well as a limited number of live swine to pork processors.
Prepared Foods: Prepared Foods operations include manufacturing
and marketing frozen and refrigerated food products and logistics
operations to move products through the supply chain. Products
include pepperoni, bacon, beef and pork pizza toppings, pizza crusts,
fl our and corn tortilla products, appetizers, prepared meals, ethnic
foods, soups, sauces, side dishes, meat dishes and processed meats.
Products are marketed domestically to food retailers, foodservice
distributors, restaurant operators and noncommercial foodservice
establishments such as schools, hotel chains, healthcare facilities,
the military and other food processors, as well as to international
markets throughout the world.
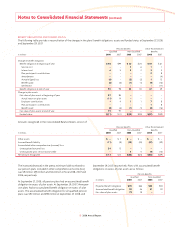
Prepared
in millions Chicken Beef Pork Foods Other Consolidated
Fiscal year ended September 27, 2008
Sales $8,900 $11,664 $3,587 $2,711 $ – $26,862
Operating income (loss) (118) 106 280 63 – 331
Other expense 177
Income from continuing operations before income taxes 154
Depreciation(a) 244 117 31 67 – 459
Total assets(b) 4,990 3,169 898 971 663 10,691
Additions to property, plant and equipment(c) 258 83 21 46 15 423
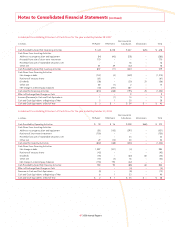
Fiscal year ended September 29, 2007
Sales $8,210 $11,540 $3,314 $2,665 $ – $25,729
Operating income 325 51 145 92 – 613
Other expense 203
Income from continuing operations before income taxes 410
Depreciation(a) 260 120 31 61 – 472
Total assets(b) 4,467 3,207 814 961 614 10,063
Additions to property, plant and equipment(c) 164 33 10 25 47 279
Fiscal year ended September 30, 2006
Sales $7,958 $10,866 $3,067 $2,698 $ – $24,589
Operating income (loss) 94 (254) 55 55 – (50)
Other expense 218
Loss from continuing operations before income taxes (268)
Depreciation(a) 262 117 30 63 – 472
Total assets(b) 4,395 3,139 847 1,021 1,561 10,963
Additions to property, plant and equipment(c) 225 134 14 55 100 528
(a) Excludes depreciation related to discontinued operation of $9 million, $10 million and $9 million for fi scal years 2008, 2007 and 2006, respectively.
(b) Excludes assets held for sale related to discontinued operation of $159 million, $164 million and $158 million for fi scal years 2008, 2007 and 2006, respectively.
(c) Excludes additions to property, plant and equipment related to discontinued operation of $2 million, $6 million and $3 million for fi scal years 2008, 2007 and 2006, respectively.