Tyson Foods 2008 Annual Report Download - page 49
Download and view the complete annual report
Please find page 49 of the 2008 Tyson Foods annual report below. You can navigate through the pages in the report by either clicking on the pages listed below, or by using the keyword search tool below to find specific information within the annual report.-
 1
1 -
2
-
3
-
4
-
5
-
6
-
7
-
8
-
9
-
10
-
11
-
12
-
13
-
14
-
15
-
16
-
17
-
18
-
19
-
20
-
21
-
22
-
23
-
24
-
25
-
26
-
27
-
28
-
29
-
30
-
31
-
32
-
33
-
34
-
35
-
36
-
37
-
38
-
 39
39 -
 40
40 -
 41
41 -
 42
42 -
 43
43 -
 44
44 -
 45
45 -
 46
46 -
 47
47 -
 48
48 -
 49
49 -
 50
50 -
 51
51 -
 52
52 -
 53
53 -
 54
54 -
 55
55 -
 56
56 -
 57
57 -
 58
58 -
 59
59 -
60
-
61
-
62
-
63
-
64
-
65
-
66
-
67
-
68
-
69
-
70
-
71
-
72
 |
 |

47 2008 Annual Report
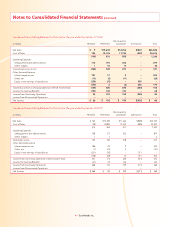
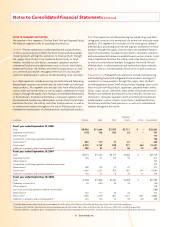
Notes to Consolidated Financial Statements (continued)
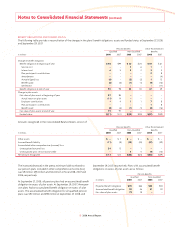
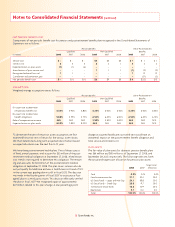
Condensed Consolidating Statement of Cash Flows for the year ended September 29, 2007
Non-Guarantor
in millions TFI Parent TFM Parent Subsidiaries Eliminations Total
Cash Provided by (Used for) Operating Activities $ (22) $ 278 $ 447 $(25) $ 678
Cash Flows From Investing Activities:
Additions to property, plant and equipment (14) (40) (231) – (285)
Proceeds from sale of short-term investment 770 – – – 770
Proceeds from sale of marketable securities, net – – 16 – 16
Other, net 81 29 (32) – 78
Cash Provided by (Used for) Investing Activities 837 (11) (247) – 579
Cash Flows From Financing Activities:
Net change in debt (747) (4) (459) – (1,210)
Purchase of treasury shares (61) – – – (61)
Dividends (56) – (25) 25 (56)
Other, net 80 (7) 2 – 75
Net change in intercompany balances (30) (257) 287 – –
Cash Used for Financing Activities (814) (268) (195) 25 (1,252)
Effect of Exchange Rate Change on Cash – – 9 – 9
Increase (Decrease) in Cash and Cash Equivalents 1 (1) 14 – 14
Cash and Cash Equivalents at Beginning of Year 2 1 25 – 28
Cash and Cash Equivalents at End of Year $ 3 $ – $ 39 $ – $ 42
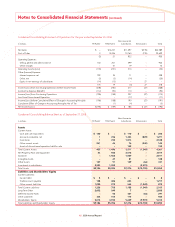
Condensed Consolidating Statement of Cash Flows for the year ended September 30, 2006
Non-Guarantor
in millions TFI Parent TFM Parent Subsidiaries Eliminations Total
Cash Provided by Operating Activities $ 18 $ 76 $ 338 $(60) $ 372
Cash Flows From Investing Activities:
Additions to property, plant and equipment (81) (153) (297) – (531)
Purchase of short-term investment (750) – – – (750)
Proceeds from sale of marketable securities, net – – 23 – 23
Other, net 29 (15) 20 – 34
Cash Used for Investing Activities (802) (168) (254) – (1,224)
Cash Flows From Financing Activities:
Net change in debt 1,087 (101) (2) – 984
Purchase of treasury shares (42) – – – (42)
Dividends (55) – (60) 60 (55)
Other, net (57) (2) 16 – (43)
Net change in intercompany balances (153) 195 (42) – –
Cash Provided by (Used for) Financing Activities 780 92 (88) 60 844
Effect of Exchange Rate Change on Cash – – (4) – (4)
Decrease in Cash and Cash Equivalents (4) – (8) – (12)
Cash and Cash Equivalents at Beginning of Year 6 1 33 – 40
Cash and Cash Equivalents at End of Year $ 2 $ 1 $ 25 $ – $ 28