Tyson Foods 2008 Annual Report Download - page 36
Download and view the complete annual report
Please find page 36 of the 2008 Tyson Foods annual report below. You can navigate through the pages in the report by either clicking on the pages listed below, or by using the keyword search tool below to find specific information within the annual report.-
 1
1 -
2
-
3
-
4
-
5
-
6
-
7
-
8
-
9
-
10
-
11
-
12
-
13
-
14
-
15
-
16
-
17
-
18
-
19
-
20
-
21
-
22
-
23
-
24
-
25
-
 26
26 -
 27
27 -
 28
28 -
 29
29 -
 30
30 -
 31
31 -
 32
32 -
 33
33 -
 34
34 -
 35
35 -
 36
36 -
 37
37 -
 38
38 -
 39
39 -
 40
40 -
 41
41 -
 42
42 -
 43
43 -
 44
44 -
 45
45 -
 46
46 -
47
-
48
-
49
-
50
-
51
-
52
-
53
-
54
-
55
-
56
-
57
-
58
-
59
-
60
-
61
-
62
-
63
-
64
-
65
-
66
-
67
-
68
-
69
-
70
-
71
-
72
 |
 |

34 Tyson Foods, Inc.
NOTE 1: BUSINESS AND SUMMARY OF
SIGNIFICANT ACCOUNTING POLICIES
Description of Business: Tyson Foods, Inc. (collectively, “Company,”
“we,” “us” or “our”), founded in 1935 with world headquarters in
Springdale, Arkansas, is the world’s largest processor and marketer
of chicken, beef and pork and the second-largest food production
company in the Fortune 500. We produce a wide variety of brand
name protein-based and prepared food products marketed in the
United States and more than 90 countries around the world. We
are a recognized market leader in the retail and foodservice markets
we serve. We have approximately 107,000 employees and more than
300 facilities and offi ces in 28 states and 22 countries.
Consolidation: The consolidated fi nancial statements include the
accounts of all wholly-owned subsidiaries, as well as majority-
owned subsidiaries for which we have a controlling interest. All
signifi cant intercompany accounts and transactions have been
eliminated in consolidation.
We have an investment in a joint venture, Dynamic Fuels LLC (Dynamic),
in which we have a 50 percent ownership interest. Dynamic qualifi es
as a variable interest entity under Financial Accounting Standards
Board (FASB) Interpretation No. 46(R) “Consolidation of Variable
Interest Entities, an interpretation of ARB No. 51” (FIN 46(R)). Effective
June 30, 2008, we began consolidating Dynamic since we are the
primary benefi ciary as defi ned by FIN 46(R).
Fiscal Year: We utilize a 52- or 53-week accounting period ending on
the Saturday closest to September 30.
Reclassifi cation: In the fourth quarter fi scal 2008, we began to man-
age and report the operating results and identifi able assets of our
logistics operations in the segment in which the product being
moved relates. As a result, our operating segments now refl ect
logistics operations which were previously included in Other. All
prior periods have been restated to refl ect this change.
Discontinued Operation: On June 25, 2008, we executed a letter of
intent with XL Foods Inc. to sell the beef processing, cattle feed yard
and fertilizer assets of Lakeside Farm Industries Ltd. (Lakeside), our
wholly-owned Canadian subsidiary. The fi nancial statements report
Lakeside as a discontinued operation. See Note 3: Discontinued
Operation in the Notes to Consolidated Financial Statements for
further information. Accordingly, all prior periods have been restated.
Cash and Cash Equivalents: Cash equivalents consist of investments
in short-term, highly liquid securities having original maturities of
three months or less, which are made as part of our cash manage-
ment activity. The carrying values of these assets approximate their
fair market values. We primarily utilize a cash management system
with a series of separate accounts consisting of lockbox accounts for
receiving cash, concentration accounts where funds are moved to,
and several “zero-balance” disbursement accounts for funding payroll,
accounts payable, livestock procurement, grower payments, etc.
As a result of our cash management system, checks issued, but not
presented to the banks for payment, may result in negative book cash
balances. These negative book cash balances are included in trade
accounts payable and other current liabilities. Checks outstanding in
excess of related book cash balances totaled approximately $322 mil-
lion at September 27, 2008, and $255 million at September 29, 2007.
Accounts Receivable: We record trade accounts receivable at net
realizable value. This value includes an appropriate allowance for
estimated uncollectible accounts to refl ect any loss anticipated on
the trade accounts receivable balances and charged to the provision
for doubtful accounts. We calculate this allowance based on our
history of write-offs, level of past due accounts and relationships
with and economic status of our customers. We generally do not
have collateral for our receivables, but we do periodically evaluate
the credit worthiness of our customers.
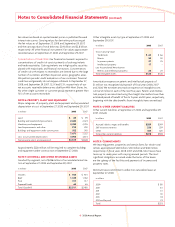
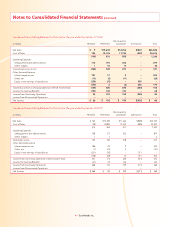
Inventories: Processed products, livestock and supplies and other
are valued at the lower of cost or market. Cost includes purchased
raw materials, live purchase costs, growout costs (primarily feed,
contract grower pay and catch and haul costs), labor and manufac-
turing and production overhead, which are related to the purchase
and production of inventories.
in millions 2008 2007
Processed products:
Weighted-average method –
chicken and prepared foods $ 920 $ 773
First-in, fi rst-out method – beef and pork 571 514
Livestock – fi rst-in, fi rst-out method 701 573
Supplies and other – weighted-average method 346 299
Total inventory $2,538 $2,159
Depreciation: We primarily use the straight-line method to calculate
depreciation, using estimated lives for buildings and leasehold improve-
ments of 10 to 33 years, machinery and equipment of three to 12 years
and land improvements and other of three to 20 years.
Long-Lived Assets: We review the carrying value of long-lived
assets at each balance sheet date if indication of impairment exists.
Recoverability is assessed using undiscounted cash fl ows based on
historical results and current projections of earnings before interest
and taxes. We measure impairment as the excess of carrying cost
over the fair value of an asset. The fair value of an asset is measured
using discounted cash fl ows of future operating results based on a
discount rate that corresponds to our cost of capital.
Notes to Consolidated Financial Statements