Tyson Foods 2008 Annual Report Download - page 15
Download and view the complete annual report
Please find page 15 of the 2008 Tyson Foods annual report below. You can navigate through the pages in the report by either clicking on the pages listed below, or by using the keyword search tool below to find specific information within the annual report.-
 1
1 -
2
-
3
-
4
-
 5
5 -
 6
6 -
 7
7 -
 8
8 -
 9
9 -
 10
10 -
 11
11 -
 12
12 -
 13
13 -
 14
14 -
 15
15 -
 16
16 -
 17
17 -
 18
18 -
 19
19 -
 20
20 -
 21
21 -
 22
22 -
 23
23 -
 24
24 -
 25
25 -
26
-
27
-
28
-
29
-
30
-
31
-
32
-
33
-
34
-
35
-
36
-
37
-
38
-
39
-
40
-
41
-
42
-
43
-
44
-
45
-
46
-
47
-
48
-
49
-
50
-
51
-
52
-
53
-
54
-
55
-
56
-
57
-
58
-
59
-
60
-
61
-
62
-
63
-
64
-
65
-
66
-
67
-
68
-
69
-
70
-
71
-
72
 |
 |

13 2008 Annual Report
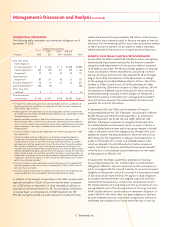
Management’s Discussion and Analysis (continued)
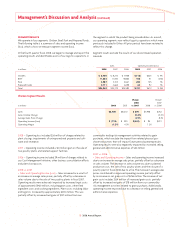
2007 vs. 2006
• Decrease in cost of sales as a percentage of sales primarily was due
to the increase in average sales prices, while average live prices and
production costs did not increase at the same rate.
• Cost of sales increased by $661 million, with an increase in cost per
pound contributing to an $853 million increase, offset by a decrease
in sales volume reducing cost of sales by $192 million.
• Increase in net grain costs of $256 million, which included $334 mil-
lion of increased grain costs, partially offset by increased net gains
of $78 million from our commodity risk management activities
related to grain purchases.
• Increase in average domestic live cattle and hog costs, as well as
an increase in domestic pork sales volume, increased cost of sales
by approximately $682 million.
• Decrease in Chicken segment sales volume decreased cost of
sales by approximately $346 million, primarily due to planned
production cuts, the sale of two poultry plants and the closure
of a poultry plant in fi scal 2006 due to a fi re.
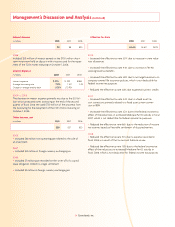
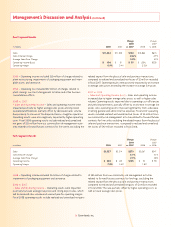
Selling, General and Administrative
in millions 2008 2007 2006
Selling, general and administrative $879 $814 $930
As a percentage of sales 3.3% 3.2% 3.8%
2008 vs. 2007
• Increase of $29 million related to unfavorable investment returns
on company-owned life insurance, which is used to fund non-qualifi ed
retirement plans.
• Increase of $16 million related to advertising and sales promotions.
• Increase of $14 million due to a favorable actuarial adjustment
related to retiree healthcare plan recorded in fi scal 2007.
• Increase of $9 million due to a gain recorded in fi scal 2007 on the
disposition of an aircraft.
2007 vs. 2006
• Decrease of $39 million in advertising and sales promotion expenses.
• Decrease of $27 million due to a favorable actuarial adjustment
related to retiree healthcare plan recorded in fi scal 2007 compared
to an unfavorable adjustment recorded in fi scal 2006.
• Decrease of $15 million in other professional fees.
• Decrease of $18 million due to a gain recorded in fi scal 2007 on the
disposition of an aircraft, as well as favorable investment returns on
company-owned life insurance.
• We had various other savings recognized as part of our Cost
Management Initiative. These savings are in addition to some of the
decreases above and include management salaries, travel, relocation
and recruiting, personnel awards, as well as other various savings.
• Increase of $18 million in earnings-based incentive compensation.
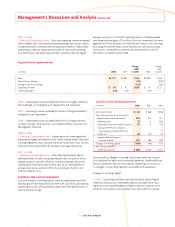
Other Charges
in millions 2008 2007 2006
$36 $2 $70
2008
• Included $17 million charge related to restructuring our Emporia,
Kansas, beef operation.
• Included $13 million charge related to closing our Wilkesboro,
North Carolina, Cooked Products poultry plant.
• Included $6 million of severance charges related to the FAST initiative.
2006
• Included $47 million of charges related to closing our Norfolk and
West Point, Nebraska, operations.
• Included $14 million of charges related to closing our Independence
and Oelwein, Iowa, operations.
• Included $9 million of severance accruals related to our Cost
Management Initiative announced in July 2006.