Tyson Foods 2008 Annual Report Download - page 43
Download and view the complete annual report
Please find page 43 of the 2008 Tyson Foods annual report below. You can navigate through the pages in the report by either clicking on the pages listed below, or by using the keyword search tool below to find specific information within the annual report.-
 1
1 -
2
-
3
-
4
-
5
-
6
-
7
-
8
-
9
-
10
-
11
-
12
-
13
-
14
-
15
-
16
-
17
-
18
-
19
-
20
-
21
-
22
-
23
-
24
-
25
-
26
-
27
-
28
-
29
-
30
-
31
-
32
-
 33
33 -
 34
34 -
 35
35 -
 36
36 -
 37
37 -
 38
38 -
 39
39 -
 40
40 -
 41
41 -
 42
42 -
 43
43 -
 44
44 -
 45
45 -
 46
46 -
 47
47 -
 48
48 -
 49
49 -
 50
50 -
 51
51 -
 52
52 -
 53
53 -
54
-
55
-
56
-
57
-
58
-
59
-
60
-
61
-
62
-
63
-
64
-
65
-
66
-
67
-
68
-
69
-
70
-
71
-
72
 |
 |

41 2008 Annual Report
Notes to Consolidated Financial Statements (continued)
Fair values are based on quoted market prices or published forward
interest rate curves. Carrying values for derivative positions equal
the fair values as of September 27, 2008, and September 29, 2007,
and the carrying value of total debt was $2.9 billion and $2.8 billion,
respectively. All other fi nancial instruments’ fair values approximate
recorded values at September 27, 2008, and September 29, 2007.
Concentrations of Credit Risk: Our fi nancial instruments exposed to
concentrations of credit risk consist primarily of cash equivalents
and trade receivables. Cash equivalents are in high quality securities
placed with major banks and fi nancial institutions. Concentrations
of credit risk with respect to receivables are limited due to the large
number of customers and their dispersion across geographic areas.
We perform periodic credit evaluations of our customers’ fi nancial
condition and generally do not require collateral. At September 27,
2008, and September 29, 2007, 12.2% and 12.1%, respectively, of our
net accounts receivable balance was due from Wal-Mart Stores, Inc.
No other single customer or customer group represents greater than
10% of net accounts receivable.
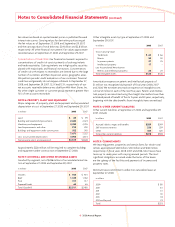
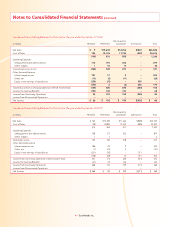
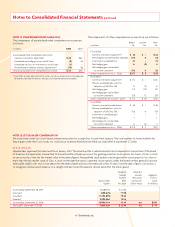
NOTE 6: PROPERTY, PLANT AND EQUIPMENT
Major categories of property, plant and equipment and accumulated
depreciation at cost, at September 27, 2008, and September 29, 2007:
in millions 2008 2007
Land $ 89 $ 99
Building and leasehold improvements 2,440 2,423
Machinery and equipment 4,382 4,255
Land improvements and other 210 200
Buildings and equipment under construction 352 245
7,473 7,222
Less accumulated depreciation 3,954 3,614
Net property, plant and equipment $3,519 $3,608
Approximately $228 million will be required to complete buildings
and equipment under construction at September 27, 2008.
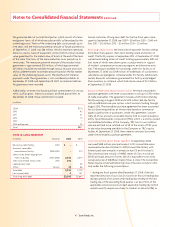
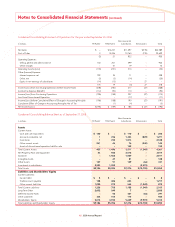
NOTE 7: GOODWILL AND OTHER INTANGIBLE ASSETS
Goodwill by segment, net of $286 million of accumulated amortiza-
tion at September 27, 2008, and September 29, 2007:
in millions 2008 2007
Chicken $ 945 $ 921
Beef 1,185 1,182
Pork 317 317
Prepared Foods 64 65
Total Goodwill $2,511 $2,485
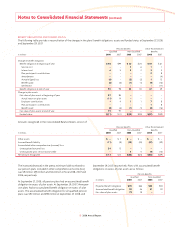
Other intangible assets by type at September 27, 2008, and
September 29, 2007:
in millions 2008 2007
Gross Carrying Value:
Trademarks $ 62 $ 66
Patents 50 50
In-process patents 27 35
Intellectual property 17 –
Less Accumulated Amortization:
Patents and intellectual property 28 25
Total Intangible Assets $128 $126
Amortization expense on patents and intellectual property of
$3 million was recognized during each of fi scal years 2008, 2007
and 2006. We estimate amortization expense on intangible assets
will be $5 million in each of the next fi ve years. Patents and intellec-
tual property are amortized using the straight-line method over their
estimated period of benefi t of fi ve to 15 years and 30 years, respectively,
beginning with the date benefi ts from intangible items are realized.
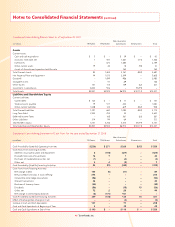
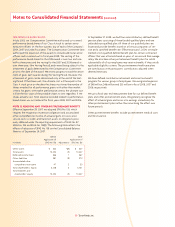
NOTE 8: OTHER CURRENT LIABILITIES
Other current liabilities at September 27, 2008, and September 29,
2007, include:
in millions 2008 2007
Accrued salaries, wages and benefi ts $259 $249
Self-insurance reserves 236 259
Other 383 420
Total other current liabilities $878 $928
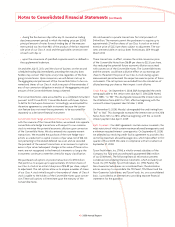
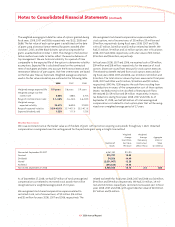
NOTE 9: COMMITMENTS
We lease equipment, properties and certain farms for which total
rentals approximated $163 million, $133 million and $146 million,
respectively, in fi scal years 2008, 2007 and 2006. Most leases have
terms up to seven years with varying renewal periods. The most
signifi cant obligations assumed under the terms of the leases
are the upkeep of the facilities and payments of insurance and
property taxes.
Minimum lease commitments under non-cancelable leases at
September 27, 2008:
in millions
2009 $ 80
2010 61
2011 41
2012 30
2013 18
2014 and beyond 23
Total $253