Tyson Foods 2008 Annual Report Download - page 18
Download and view the complete annual report
Please find page 18 of the 2008 Tyson Foods annual report below. You can navigate through the pages in the report by either clicking on the pages listed below, or by using the keyword search tool below to find specific information within the annual report.-
 1
1 -
2
-
3
-
4
-
5
-
6
-
7
-
 8
8 -
 9
9 -
 10
10 -
 11
11 -
 12
12 -
 13
13 -
 14
14 -
 15
15 -
 16
16 -
 17
17 -
 18
18 -
 19
19 -
 20
20 -
 21
21 -
 22
22 -
 23
23 -
 24
24 -
 25
25 -
 26
26 -
 27
27 -
 28
28 -
29
-
30
-
31
-
32
-
33
-
34
-
35
-
36
-
37
-
38
-
39
-
40
-
41
-
42
-
43
-
44
-
45
-
46
-
47
-
48
-
49
-
50
-
51
-
52
-
53
-
54
-
55
-
56
-
57
-
58
-
59
-
60
-
61
-
62
-
63
-
64
-
65
-
66
-
67
-
68
-
69
-
70
-
71
-
72
 |
 |

16 Tyson Foods, Inc.
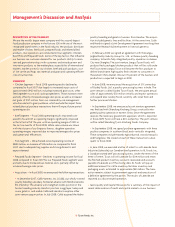
Management’s Discussion and Analysis (continued)
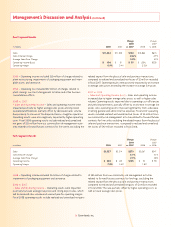
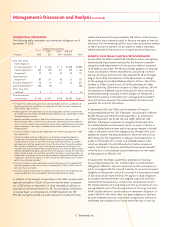
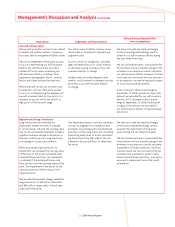
Beef Segment Results
Change Change
2008 2007
in millions 2008 2007 vs. 2007 2006 vs. 2006
Sales $11,664 $11,540 $124 $10,866 $674
Sales Volume Change (4.6)% 0.9%
Average Sales Price Change 5.9% 5.3%
Operating Income (Loss) $ 106 $ 51 $ 55 $ (254) $305
Operating Margin 0.9% 0.4% (2.3)%
2008 – Operating income included $35 million of charges related to:
plant restructuring; impairments of packaging equipment and intan-
gible assets; and severance.
2006 – Operating loss included $52 million of charges related to
plant closings, our Cost Management Initiative and other business
consolidation efforts.
2008 vs. 2007
• Sales and Operating Income – Sales and operating income were
impacted positively by higher average sales prices and improved
operational effi ciencies, partially offset by decreased sales volume
due primarily to closure of the Emporia, Kansas, slaughter operation.
Operating results were also negatively impacted by higher operating
costs. Fiscal 2008 operating results include realized and unrealized
net gains of $53 million from our commodity risk management activ-
ities related to forward futures contracts for live cattle, excluding the
related impact from the physical sale and purchase transactions,
compared to realized and unrealized net losses of $2 million recorded
in fi scal 2007. Operating results were positively impacted by an increase
in average sales prices exceeding the increase in average live prices.
2007 vs. 2006
• Sales and Operating Income (Loss) – Sales and operating income
increased due to higher average sales prices, as well as higher sales
volume. Operating results improved due to operating cost effi ciencies
and yield improvements, partially offset by an increase in average live
prices. Also, operating results improved signifi cantly from a decrease
in selling, general and administrative expenses. Fiscal 2007 operating
results included realized and unrealized net losses of $2 million from
our commodity risk management activities related to forward futures
contracts for live cattle, excluding the related impact from the physical
sale and purchase transactions, compared to realized and unrealized
net losses of $40 million recorded in fi scal 2006.
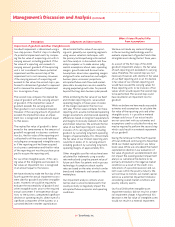
Pork Segment Results
Change Change
2008 2007
in millions 2008 2007 vs. 2007 2006 vs. 2006
Sales $3,587 $3,314 $273 $3,067 $247
Sales Volume Change 6.1% 5.1%
Average Sales Price Change 2.1% 2.8%
Operating Income $ 280 $ 145 $135 $ 55 $ 90
Operating Margin 7.8% 4.4% 1.8%
2008 – Operating income included $5 million of charges related to
impairment of packaging equipment and severance.
2008 vs. 2007
• Sales and Operating Income – Operating results were impacted
positively by lower average live prices and strong export sales, which
led to increased sales volume and a record year for operating margins.
Fiscal 2008 operating results include realized and unrealized net gains
of $95 million from our commodity risk management activities
related to forward futures contracts for live hogs, excluding the
related impact from the physical sale and purchase transactions,
compared to realized and unrealized net gains of $3 million recorded
in fi scal 2006. This was partially offset by higher operating costs, as
well as lower average sales prices.